. 2012 Apr;12(8):1170-5.
doi: 10.1002/pmic.201100515.

PASSEL: the PeptideAtlas SRMexperiment library

Affiliations

PASSEL: the PeptideAtlas SRMexperiment library

Terry Farrah et al. Proteomics. 2012 Apr.

Abstract

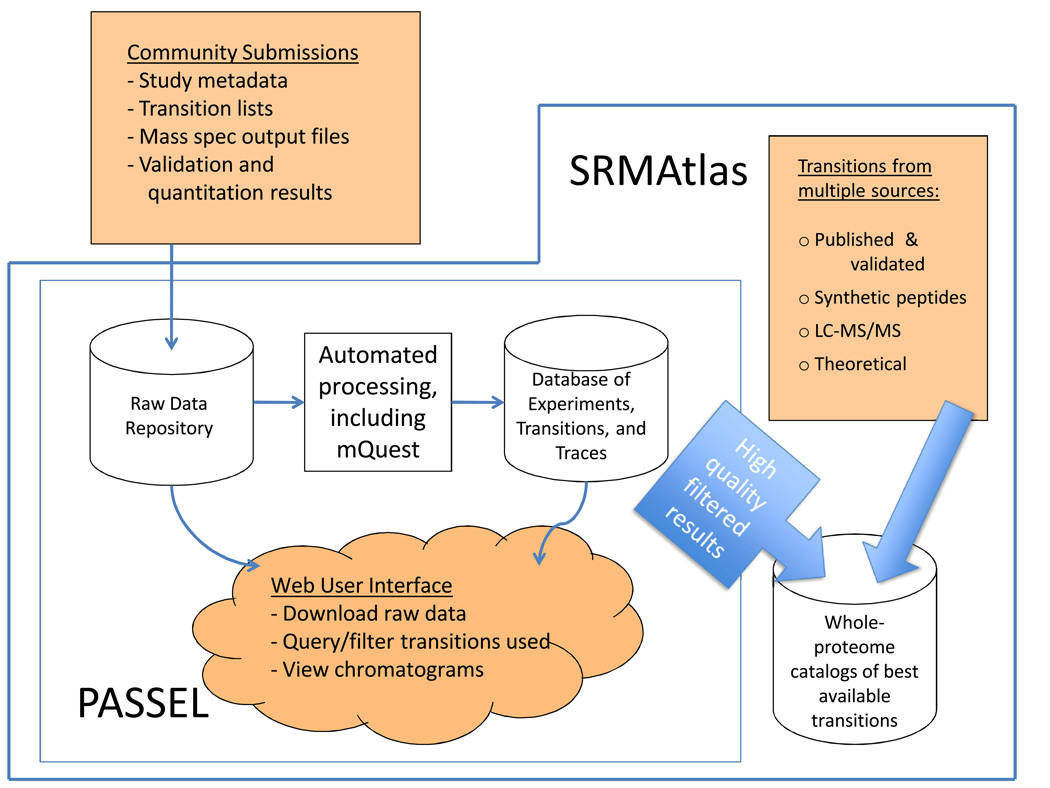
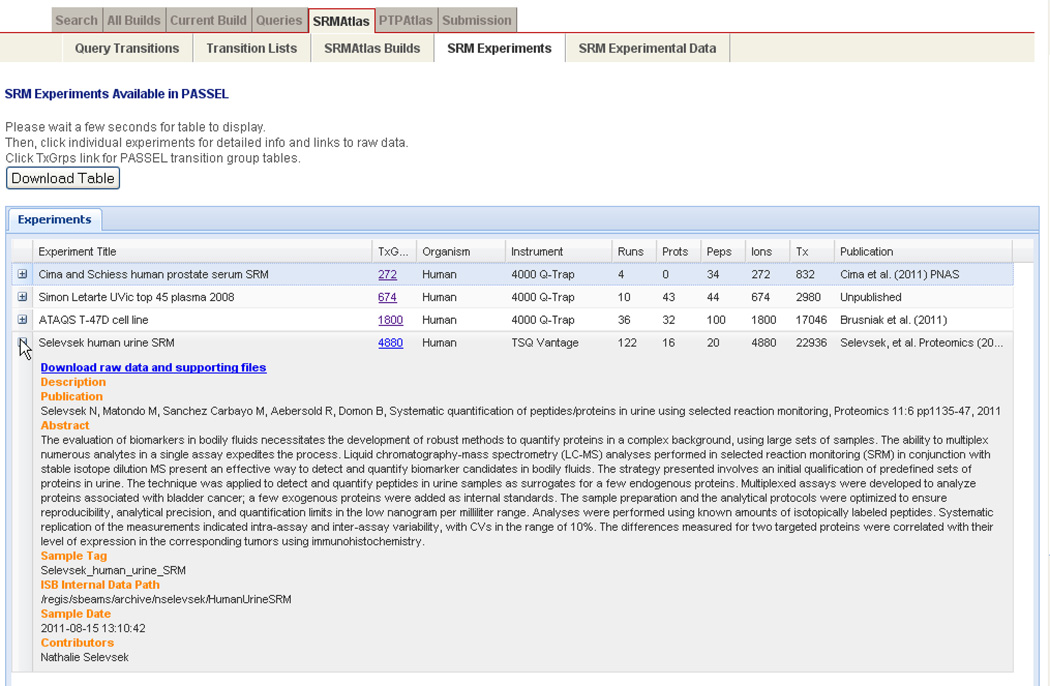
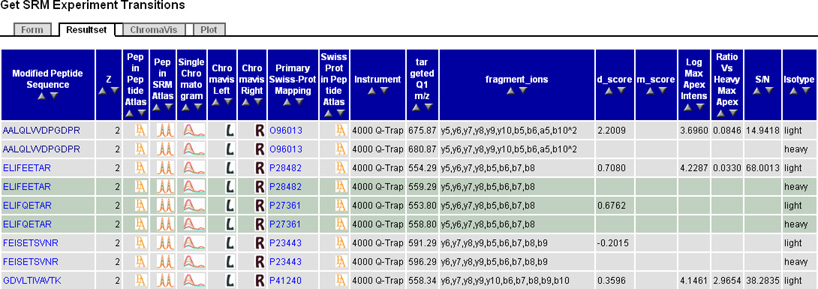
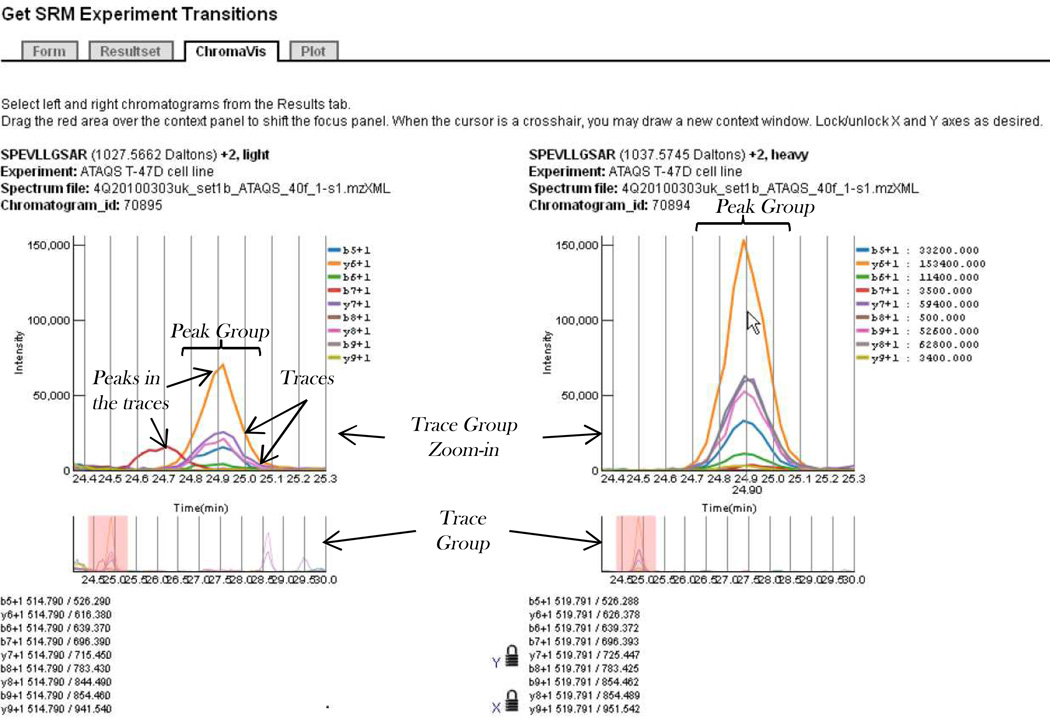
Public repositories for proteomics data have accelerated proteomics research by enabling more efficient cross-analyses of datasets, supporting the creation of protein and peptide compendia of experimental results, supporting the development and testing of new software tools, and facilitating the manuscript review process. The repositories available to date have been designed to accommodate either shotgun experiments or generic proteomic data files. Here, we describe a new kind of proteomic data repository for the collection and representation of data from selected reaction monitoring (SRM) measurements. The PeptideAtlas SRM Experiment Library (PASSEL) allows researchers to easily submit proteomic data sets generated by SRM. The raw data are automatically processed in a uniform manner and the results are stored in a database, where they may be downloaded or browsed via a web interface that includes a chromatogram viewer. PASSELenables cross-analysis of SRMdata, supports optimization of SRMdata collection, and facilitates the review process of SRMdata. Further, PASSELwill help in the assessment of proteotypic peptide performance in a wide array of samples containing the same peptide, as well as across multiple experimental protocols.


Conflict of interest statement

The authors declare no financial or commercial conflicts of interest.

Figures

Figure 1
Figure 1. Overview of the PASSEL process
SRM experimental results submitted by the community are stored in a raw data repository that is accessible via a web user interface. These data are also processed through a software pipeline which extracts trace groups from the raw data and assigns various quality metrics using mQuest; the results of this processing are stored in a database which is also browsable via a web interface. The highest quality transitions serve as one of several sources for the SRMAtlas whole-proteome catalogs of best available peptides and transitions.
Figure 2
Figure 2
(A) PASSEL experiment browser. Four publicly available experiments are shown, with the second entry expanded to show more details. Clicking the TxGrps hyperlink displays all of the transition groups for the experiment in the Transition Group Browser (Figure 2B). (B) PASSEL transition group browser. Here, the user has selected to display all transition groups from a particular SRM run. Each row contains data for one measured transition group, including peptide sequence, charge, protein, instrument, m/z, fragment ions measured, quality scores, and quantitation metrics. Peptide sequences and protein names are hyperlinked so that one can obtain with a single click all results for a particular peptide or protein. Small icons provide links to PeptideAtlas, SRMAtlas best transitions, and the Chromavis chromatogram viewer. At the bottom of the page (not shown) are links for downloading the data into a spreadsheet.
Figure 2
Figure 2
(A) PASSEL experiment browser. Four publicly available experiments are shown, with the second entry expanded to show more details. Clicking the TxGrps hyperlink displays all of the transition groups for the experiment in the Transition Group Browser (Figure 2B). (B) PASSEL transition group browser. Here, the user has selected to display all transition groups from a particular SRM run. Each row contains data for one measured transition group, including peptide sequence, charge, protein, instrument, m/z, fragment ions measured, quality scores, and quantitation metrics. Peptide sequences and protein names are hyperlinked so that one can obtain with a single click all results for a particular peptide or protein. Small icons provide links to PeptideAtlas, SRMAtlas best transitions, and the Chromavis chromatogram viewer. At the bottom of the page (not shown) are links for downloading the data into a spreadsheet.
Figure 3
Figure 3. Chromavis side-by-side chromatogram viewer
Trace groups for measurements targeting light (unlabeled) and heavy (isotopically labeled) versions of the same peptide in the same SRM run are displayed for comparison. X- and Y-axes are locked to same scales and ranges, and pointer hovers over large peak group at 24.89 minutes in the chromatogram on the right. Here, coinciding peaks in most of the ten traces almost certainly represent detection of the heavy-labeled standard. A similar looking, though less intense, peak group exists at the same time point in the left chromatogram and thus likely represents detection of the matching endogenous light peptide but at lower concentration. Also in the left chromatogram is a single peak at 24.7 minutes; this likely represents detection of one fragment of a different peptide. User may very rapidly zoom in and out by selecting a desired region in a complete chromatogram (bottom) or an upper zoom-in display.

References

    1. Aebersold R, Mann M. Mass spectrometry-based proteomics. Nature. 2003;422:198–207. - PubMed
    1. Desiere F, Deutsch EW, Nesvizhskii AI, Mallick P, et al. Integration with the human genome of peptide sequences obtained by high-throughput mass spectrometry. Genome Biol. 2004;6:R9. - PMC - PubMed
    1. Desiere F, Deutsch EW, King NL, Nesvizhskii AI, et al. The PeptideAtlas project. Nucleic Acids Res. 2006;34:D655–D658. - PMC - PubMed
    1. Keller A, Eng J, Zhang N, Li XJ, Aebersold R. A uniform proteomics MS/MS analysis platform utilizing open XML file formats. Mol Syst Biol. 2005;1 2005.0017. - PMC - PubMed
    1. Deutsch EW, Mendoza L, Shteynberg D, Farrah T, et al. A guided tour of the Trans-Proteomic Pipeline. Proteomics. 2010;10:1150–1159. - PMC - PubMed

Publication types

LinkOut - more resources