

Review
doi: 10.1098/rsif.2011.0823.
Epub 2012 Feb 7.
Two decades of studying non-covalent biomolecular assemblies by means of electrospray ionization mass spectrometry
Affiliations
- PMID: 22319100
- PMCID: PMC3306659
- DOI: 10.1098/rsif.2011.0823
Item in Clipboard
Review
Two decades of studying non-covalent biomolecular assemblies by means of electrospray ionization mass spectrometry
J R Soc Interface.
.
Abstract
Mass spectrometry (MS) is a recognized approach for characterizing proteins and the complexes they assemble into. This application of a long-established physico-chemical tool to the frontiers of structural biology has stemmed from experiments performed in the early 1990s. While initial studies focused on the elucidation of stoichiometry by means of simple mass determination, developments in MS technology and methodology now allow researchers to address questions of shape, inter-subunit connectivity and protein dynamics. Here, we chart the remarkable rise of MS and its application to biomolecular complexes over the last two decades.
Figures
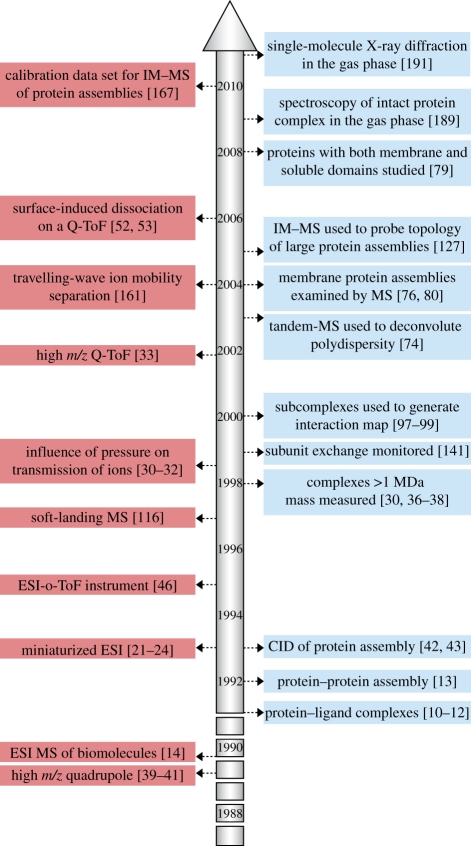
Some important milestones in the developments in MS instrumentation for the study of macromolecular assemblies (left-hand side), and the subsequent methodologies they enabled (right-hand side). The first non-covalent complexes were measured by means of MS in 1991, and the following two decades have seen dramatic progress in both the technology and its application to problems in structural biology.

Four example mass spectra of the same protein complex subjected to different experimental conditions. These spectra show the complex intact; solution adjusted conditions to reveal the presence of monomers and dimers; denaturing solution conditions (addition of organic solvent and acid); and finally MS activating conditions showing the gas phase fragmentation. The protein complex, a small Heat Shock Protein (sHSP) TaHSP16.9, is an oligomeric species comprising six dimeric building blocks to form a 12 mer (see inset 2(a)). (a) Mass spectrum of TaHSP16.9 under near ‘native’ conditions applying mild instrument conditions such as low collision voltages and ion guide pressures optimized to allow the transmission of the ions through the mass spectrometer. The spectrum shows a narrow charge series (30+ to 34+) corresponding to 202 237 Da, the mass of the intact 12 mer of HSP16.9 (see the inset). The multiple charge states are a direct result of the distribution of charges on the nESI droplet. (b) Example spectrum showing the effects of solution phase manipulation by the addition of isopropanol 10% (v/v). The observation of dimer in the spectrum suggests a destabilization of the dimer–dimer interfaces, the interactions required to construct the intact 12 mer. (c) Denaturing conditions (50% acetonitrile and 0.1% formic acid (v/v), aqueous) reduces the 12 mer to monomeric units with a broad charge state distribution. The larger the surface area exposed, the more charges can be accommodated, and therefore a narrow distribution of low average charge suggests a folded protein state whereas an unfolded/disordered protein will have an extended highly charged distribution. (d) Spectrum under activating conditions in which monomers are ejected from the intact 12 mer to form an 11 mer and subsequently a 10 mer. Expelled monomers can be observed at low m/z. Unless otherwise stated, all spectra were obtained on a modified Q-ToF instrument (Waters, Manchester), as described previously [27], with a 10 µM monomer concentration of TaHSP16.9 in 200 mM ammonium acetate pH 6.9.
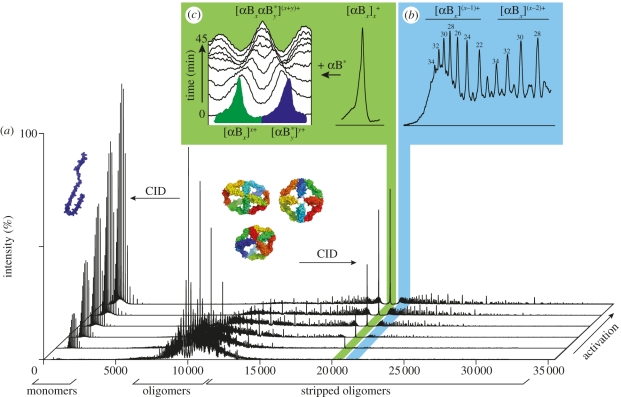
Nano-ESI MS of the heterogeneous ensemble populated by αB-crystallin. (a) Spectra obtained under conditions of increasing activation, indicated on the z-axis, in which ions are subjected to energetic collisions with argon atoms. The peaks at low m/z are from monomers and those at higher m/z are their complementary stripped oligomers. The peaks in the region between 18 000 and 24 000 m/z correspond to oligomers stripped of two monomers which have sufficient resolution to allow the identification and relative quantification of their individual species (b). The values for ‘x’ are indicated above each ‘even’ peak with the black dot showing the corresponding ‘odd’ stoichiometries. The peak highlighted in green at m/z ∼20 200 corresponds to all αB-crystallin doubly stripped oligomers carrying the equivalent number of charges as subunits (c). When a sample of αB-crystallin is mixed and incubated with its isotopically labelled equivalent (blue), the gradual disappearance of the homo-oligomers and the concomitant formation of the hetero-oligomer allows the quaternary dynamics and architecture to be obtained. All spectra were obtained on a modified Q-ToF instrument (Waters, Manchester), as described previously [74].
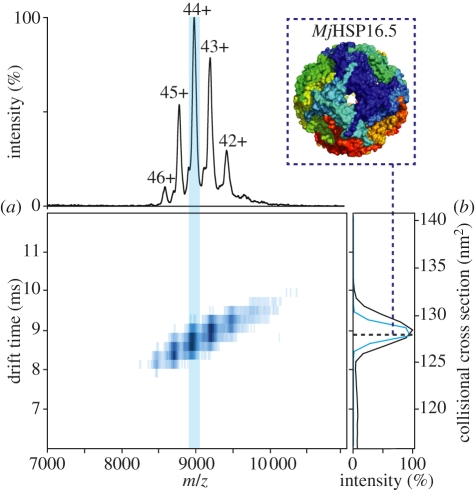
IM–MS spectrum of sHSP MjHSP16.5. (a) Two-dimensional plot of drift time versus m/z showing the summed spectrum of MjHSP16.5 under native conditions. The MS dimension is projected onto the top panel and shows a charge–state series (42+ to 46+) corresponding to a 397 kDa 24-mer (see the inset). The summation of all the drift times is shown in black (b) and the extracted individual drift time distribution for charge state 44+ is shown in blue (b). The drift time of an ion can be converted into a rotationally averaged CCS (blue dashed line) which can be compared to the crystal structure (see inset). The CSS of MjHSP16.5 matches that calculated from the crystal structure. The spectrum was acquired as described previously [123].
References
-
- Loo J. A. 1997. Studying noncovalent protein complexes by electrospray ionization mass spectrometry. Mass Spectrom. Rev. 16, 1–2310.1002/(SICI)1098-2787(1997)16:1<1::AID-MAS1>3.0.CO;2-L (doi:10.1002/(SICI)1098-2787(1997)16:1<1::AID-MAS1>3.0.CO;2-L) - DOI - DOI - PubMed
-
- Benesch J. L. P., Ruotolo B. T., Simmons D. A., Robinson C. V. 2007. Protein complexes in the gas phase: technology for structural genomics and proteomics. Chem. Rev. 107, 3544–356710.1021/cr068289b (doi:10.1021/cr068289b) - DOI - DOI - PubMed
-
- Ashcroft A. E. 2005. Recent developments in electrospray ionisation mass spectrometry: noncovalently bound protein complexes. Nat. Prod. Rep. 22, 452–46410.1039/b417724j (doi:10.1039/b417724j) - DOI - DOI - PubMed
-
- Benesch J. L. P., Ruotolo B. T. 2011. Mass Spectrometry: an approach come-of-age for structural and dynamical biology. Curr. Opin. Struct. Biol. 21, 641–64910.1016/j.sbi.2011.08.002 (doi:10.1016/j.sbi.2011.08.002) - DOI - DOI - PMC - PubMed
-
- Heck A. J. 2008. Native mass spectrometry: a bridge between interactomics and structural biology. Nat. Methods 5, 927–93310.1038/nmeth.1265 (doi:10.1038/nmeth.1265) - DOI - DOI - PubMed
Publication types
MeSH terms
Substances
Grants and funding
LinkOut - more resources
Full Text Sources
