Comparative Study
. 2012 Jun;29(6):1615-30.
doi: 10.1093/molbev/mss008. Epub 2012 Jan 12.

Concatenation and concordance in the reconstruction of mouse lemur phylogeny: an empirical demonstration of the effect of allele sampling in phylogenetics

Affiliations
Comparative Study

Concatenation and concordance in the reconstruction of mouse lemur phylogeny: an empirical demonstration of the effect of allele sampling in phylogenetics

David W Weisrock et al. Mol Biol Evol. 2012 Jun.

Abstract

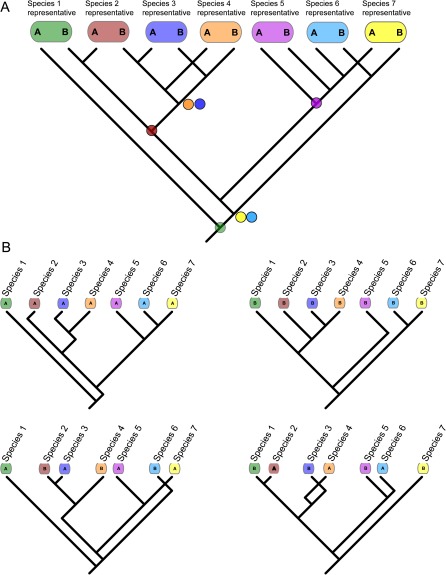
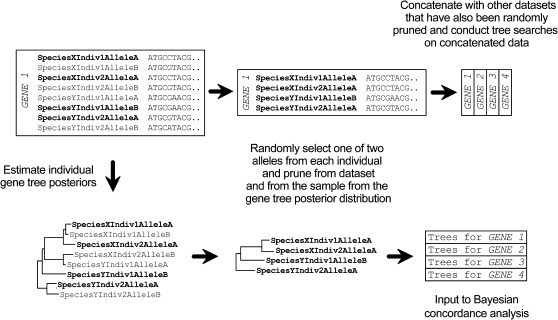
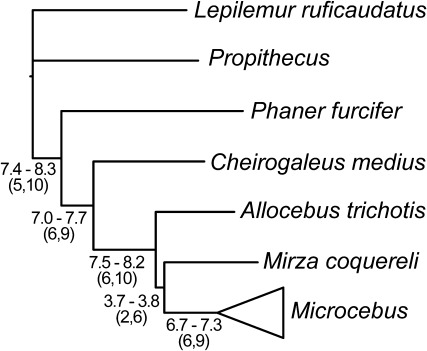
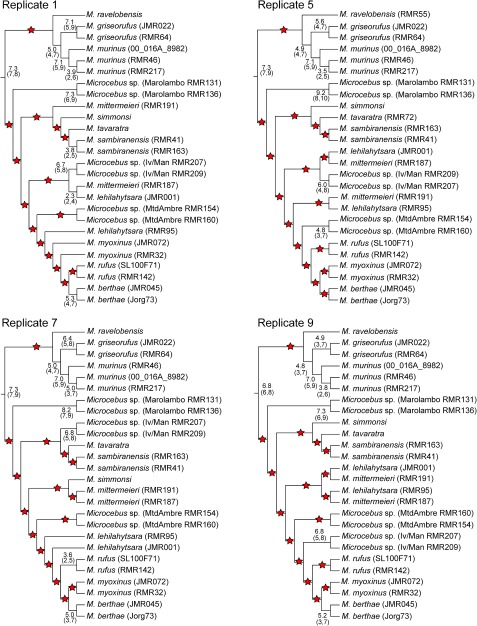
The systematics and speciation literature is rich with discussion relating to the potential for gene tree/species tree discordance. Numerous mechanisms have been proposed to generate discordance, including differential selection, long-branch attraction, gene duplication, genetic introgression, and/or incomplete lineage sorting. For speciose clades in which divergence has occurred recently and rapidly, recovering the true species tree can be particularly problematic due to incomplete lineage sorting. Unfortunately, the availability of multilocus or "phylogenomic" data sets does not simply solve the problem, particularly when the data are analyzed with standard concatenation techniques. In our study, we conduct a phylogenetic study for a nearly complete species sample of the dwarf and mouse lemur clade, Cheirogaleidae. Mouse lemurs (genus, Microcebus) have been intensively studied over the past decade for reasons relating to their high level of cryptic species diversity, and although there has been emerging consensus regarding the evolutionary diversity contained within the genus, there is no agreement as to the inter-specific relationships within the group. We attempt to resolve cheirogaleid phylogeny, focusing especially on the mouse lemurs, by employing a large multilocus data set. We compare the results of Bayesian concordance methods with those of standard gene concatenation, finding that though concatenation yields the strongest results as measured by statistical support, these results are found to be highly misleading. By employing an approach where individual alleles are treated as operational taxonomic units, we show that phylogenetic results are substantially influenced by the selection of alleles in the concatenation process.


Figures

F<sc>IG</sc>. 1.
FIG. 1.
A figurative demonstration of the effect of allele choice or sampling on the inference of the species tree from a single nuclear gene. (A) The full gene tree will contain two alleles (or gene copies) from each individual chosen to represent a species (or higher taxon). For heterozygous individuals, the two different alleles may coalesce at a point in the past (dots on nodes) that is deeper than the speciation events that gave rise to them. (B) Four possible different trees (out of many), resulting from choosing a single allele from each heterozygous individual depicted in (A). The overall figure is meant to convey the possible variation in the information content of a concatenated matrix when multiple loci are used that contain heterozygous individuals.
F<sc>ig.</sc> 2.
Fig. 2.
A pipeline of the steps involved in the pruning of allelic sequences from individuals to create replicate concatenated data sets and of pruning allelic tips from individuals in gene trees to create replicate sets of trees for Bayesian concordance analysis. One allele was randomly selected and pruned from each individual from each gene alignment and the same alleles were pruned from the trees sampled from each gene tree posterior distribution. This process resulted in data sets that can be concatenated or used in concordance analyses.
F<sc>IG</sc>. 3.
FIG. 3.
Bayesian majority-rule consensus trees reconstructed for four of the ten replicate nuclear concatenated data sets. Trees are presented as phylograms with branch lengths representing the average number of substitutions per site. Filled circles on branches indicate PP support of 0.95 or greater. Numbers on branches represent PPs < 0.95.
F<sc>IG</sc>. 4.
FIG. 4.
Different representations of the variance in cheirogaleid concatenated phylogenetic reconstruction that occurred when different alleles were sampled from an individual. Two-dimensional visualization of tree space using MDS of unweighted RF distances between trees are presented for (A) trees sampled from the posterior distributions of the ten replicate nuclear concatenated data sets and (B) trees sampled from the posterior distributions of the ten replicate nuclear + mitochondrial concatenated data sets. In both plots, minimum convex polygons encompass individual posterior distribution of trees. Corresponding majority-rule consensus trees (using a 50% minimum threshold) are presented to the right of each ordination plot. These consensus trees were reconstructed from the ten replicate consensus trees of each data source. Numbers on branches represent the number of times a branch was present.
F<sc>IG</sc>. 5.
FIG. 5.
Phylogenetic tree with nuclear-based clade CFs for relationships among genera of the Cheirogaleidae. CFs are presented as the number of genes (out of 12) supporting a relationship and are presented as the range calculated across all ten replicates of pruned nuclear gene trees. Numbers in parentheses represent the lowest and highest CF from the 95% credibility intervals across the ten replicates. Branch lengths are based on a concatenated tree (nuclear replicate 1) and are presented here to provide a relative comparison of lengths. Relationships in this tree match those of the PC trees across all replicates.
F<sc>IG</sc>. 6.
FIG. 6.
PC trees reconstructed from four of the ten replicates of pruned nuclear gene trees. CFs are presented as the number of genes (out of 12) supporting a relationship. To simplify interpretations, stars are placed on branches with CFs that have 95% credibility intervals including 0 or 1, indicating low concordance among gene trees. The trees presented here are restricted to relationships among Microcebus individuals and species. Relationships among cheirogaleid genera were consistent across replicates and are presented in figure 5.

References

    1. Ané C, Larget B, Baum DA, Smith SD, Rokas A. Bayesian estimation of concordance among gene trees. Mol Biol Evol. 2007;24:412–426. - PubMed
    1. Belfiore NM, Liu L, Moritz C. Multilocus phylogenetics of a rapid radiation in the genus Thomomys (Rodentia: Geomyidae) Syst Biol. 2008;57:294–310. - PubMed
    1. Brandley MC, Schmitz A, Reeder TW. Partitioned Bayesian analyses, partition choice, and the phylogenetic relationships of scincid lizards. Syst Biol. 2005;54:373–390. - PubMed
    1. Cranston KA, Hurwitz B, Ware D, Stein L, Wing RA. Species trees from highly incongruent gene trees in rice. Syst Biol. 2009;58:489–500. - PubMed
    1. Crovella S, Montagnon D, Rumpler Y. Highly repeated DNA sequences and systematics of malagasy primates. Hum Evol. 1995;10:35–44.

Publication types

Substances