. 2012 Feb;8(2):e1002488.
doi: 10.1371/journal.pgen.1002488. Epub 2012 Feb 2.

The mitochondrial chaperone protein TRAP1 mitigates α-Synuclein toxicity

Affiliations

The mitochondrial chaperone protein TRAP1 mitigates α-Synuclein toxicity

Erin K Butler et al. PLoS Genet. 2012 Feb.

Abstract

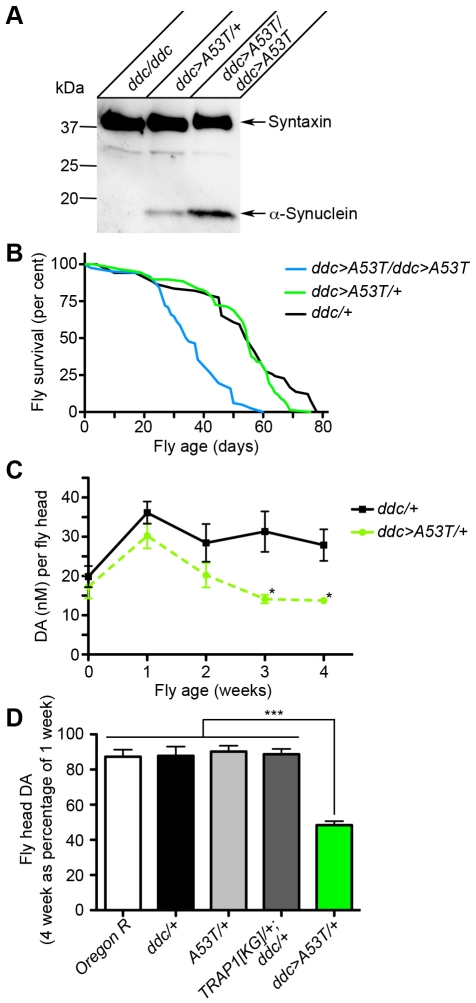
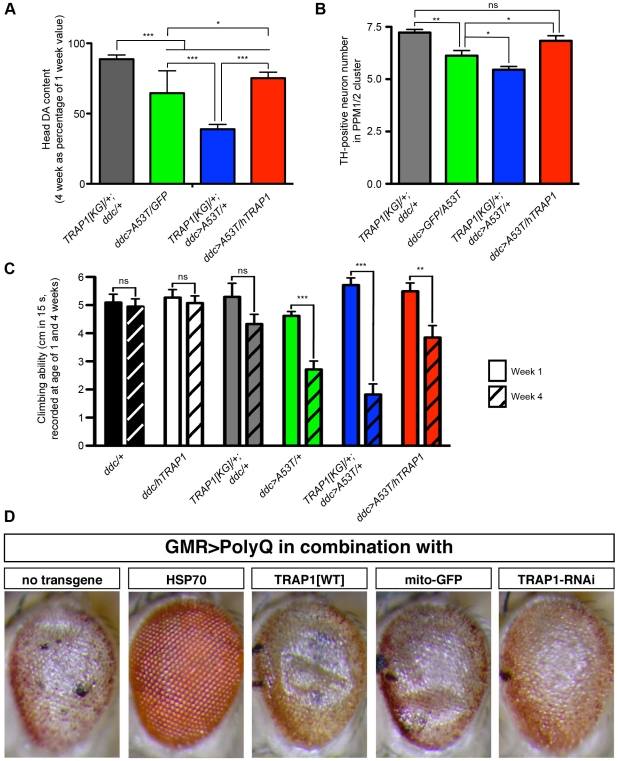
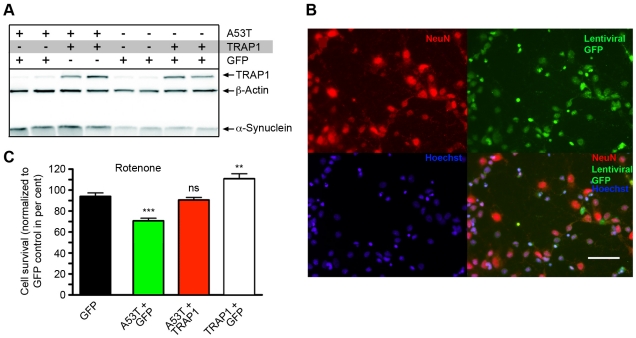
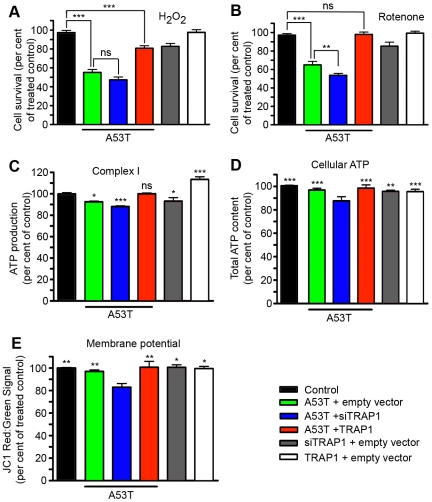
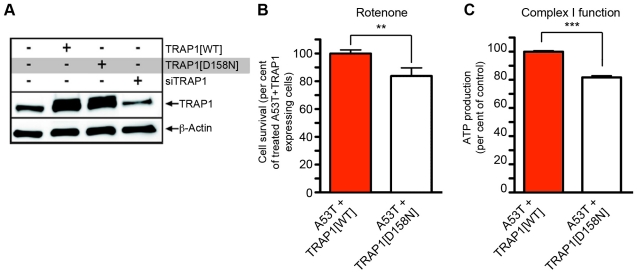
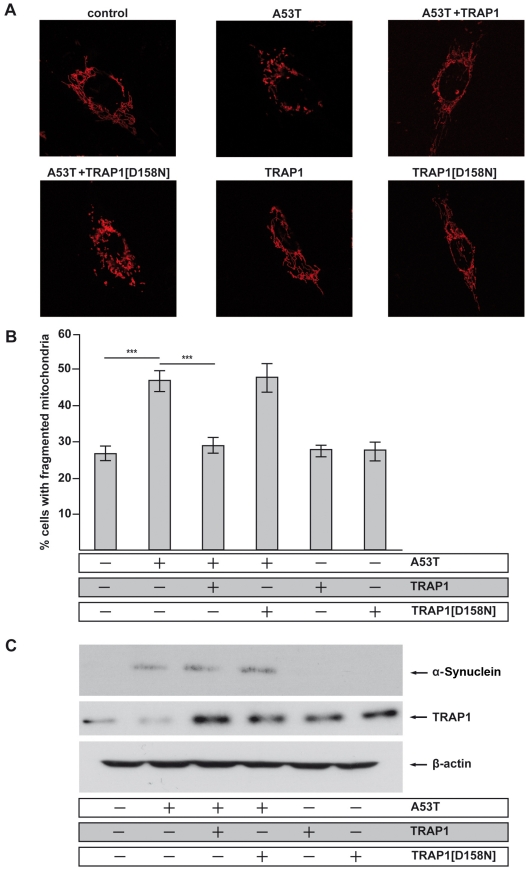
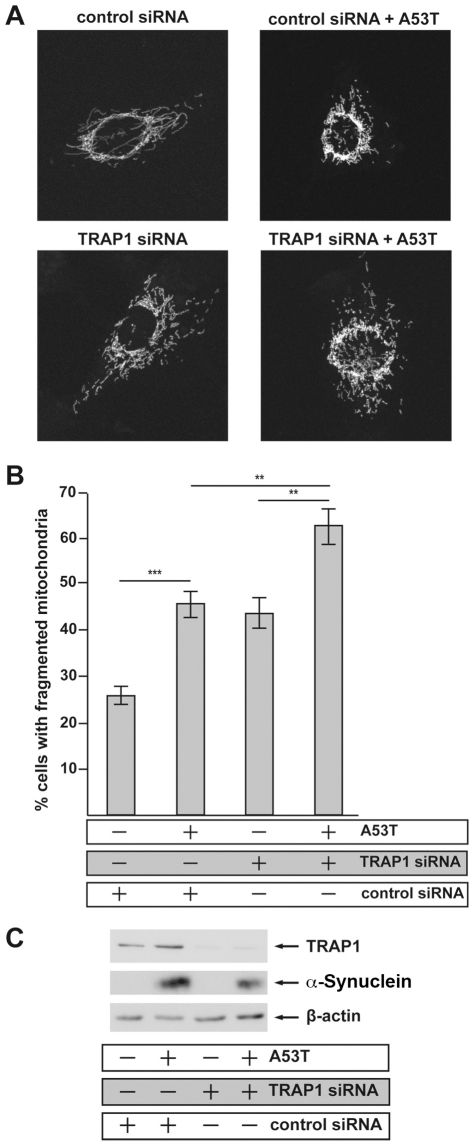
Overexpression or mutation of α-Synuclein is associated with protein aggregation and interferes with a number of cellular processes, including mitochondrial integrity and function. We used a whole-genome screen in the fruit fly Drosophila melanogaster to search for novel genetic modifiers of human [A53T]α-Synuclein-induced neurotoxicity. Decreased expression of the mitochondrial chaperone protein tumor necrosis factor receptor associated protein-1 (TRAP1) was found to enhance age-dependent loss of fly head dopamine (DA) and DA neuron number resulting from [A53T]α-Synuclein expression. In addition, decreased TRAP1 expression in [A53T]α-Synuclein-expressing flies resulted in enhanced loss of climbing ability and sensitivity to oxidative stress. Overexpression of human TRAP1 was able to rescue these phenotypes. Similarly, human TRAP1 overexpression in rat primary cortical neurons rescued [A53T]α-Synuclein-induced sensitivity to rotenone treatment. In human (non)neuronal cell lines, small interfering RNA directed against TRAP1 enhanced [A53T]α-Synuclein-induced sensitivity to oxidative stress treatment. [A53T]α-Synuclein directly interfered with mitochondrial function, as its expression reduced Complex I activity in HEK293 cells. These effects were blocked by TRAP1 overexpression. Moreover, TRAP1 was able to prevent alteration in mitochondrial morphology caused by [A53T]α-Synuclein overexpression in human SH-SY5Y cells. These results indicate that [A53T]α-Synuclein toxicity is intimately connected to mitochondrial dysfunction and that toxicity reduction in fly and rat primary neurons and human cell lines can be achieved using overexpression of the mitochondrial chaperone TRAP1. Interestingly, TRAP1 has previously been shown to be phosphorylated by the serine/threonine kinase PINK1, thus providing a potential link of PINK1 via TRAP1 to α-Synuclein.


Conflict of interest statement

The authors have declared that no competing interests exist.

Figures

Figure 1
Figure 1. [A53T]α-Synuclein expression in fly heads results in age-dependent loss of DA.
(A) Western blot showing abundance of human [A53T]α-Synuclein after aminergic neuron (ddc-GAL4)-specific expression in lysates of fly heads. While flies without [A53T]α-Synuclein transgene do not show any detectable signal for [A53T]α-Synuclein in Western blot, an increase of [A53T]α-Synuclein protein levels was observed by increasing the copy number of transgenes. Syntaxin served as a loading control and molecular weight markers are indicated. (B) Whereas ddc>A53T/+ flies displayed no significant difference in longevity as compared to ddc/+ flies, flies homozygous for ddc>A53T showed a significant decrease (p<0.001, Log rank test). (C) Compared to controls (ddc/+), ddc>A53T/+ flies showed a significant age-dependent loss of DA at 3 and 4 weeks post eclosion (*p<0.05 vs. control). (D) Only ddc>A53T flies showed a significant decrease (***p<0.001) in DA concentration in fly heads at 4 weeks. Comparisons of multiple controls were not significant (4 week values as per cent of 1 week values; ANOVA followed by Newman-Keuls Multiple Comparison Test).
Figure 2
Figure 2. TRAP1 overexpression mitigates detrimental effects induced by neuronal [A53T]α-Synuclein expression.
(A) Overexpression of [A53T]α-Synuclein under control of ddc-GAL4 resulted in reduction of DA in fly heads at 4 weeks, which was potentiated by TRAP1 deficiency (TRAP1[KG]/+;ddc>A53T/+), but mitigated by TRAP1 overexpression (ddc>A53T/hTRAP1). (B) ddc>A53T flies display a reduction of TH-positive neurons, which was potentiated by TRAP1 deficiency, but rescued to control levels by TRAP1 overexpression. (C) In negative geotaxis assays ddc>A53T flies displayed a time-dependent decline in locomotion. Reduction of TRAP1 enhanced the inability to climb (although not significant), while overexpression of hTRAP1 provided a significant rescue effect (comparison of ddc>A53T/+ vs ddc>A53T/hTRAP1 at 4 weeks: p<0.05). Statistics in (A, B): ANOVA followed by Newman-Keuls Multiple Comparison Test; (C): 2-way ANOVA followed by Bonferroni post-hoc tests. Displayed are biologically relevant comparisons. *p<0.05; **p<0.01; ***p<0.001; ns = not significant. (D) Alterations in TRAP1 levels did not influence PolyQ-induced rough eye phenotypes. Light micrographs of external eye structures show that PolyQ-induced REP was suppressed by parallel expression of HSP70. In contrast, neither overexpression of hTRAP1 or silencing of endogenous TRAP1 by RNAi had an obvious impact on external eye structure. Expression of mitochondrial localized GFP (mito-GFP) served as control.
Figure 3
Figure 3. TRAP1 overexpression protects rat cortical neurons from [A53T]α-Synuclein-induced sensitivity to rotenone.
(A) Western blot analysis of cells infected with lentivirus promoting either GFP, TRAP1 or [A53T]α-Synuclein expression. For visualization, the blot was probed with either TRAP1- or α-Synuclein-specific antibodies, respectively. ß-Actin was used for normalization. (B) Rat cortical neurons infected with lentivirus promoting GFP expression were stained for neuronal marker NeuN (red) and DNA (Hoechst, blue). A high percentage of cells showed co-localization between GFP and the neuronal marker NeuN, indicative for high infection efficacy. Scale bar indicates 43 µm. (C) Quantification of cell survival after 16 h of rotenone treatment of cells infected with viruses mediating expression of indicated protein. Significant differences compared to control (GFP) are indicated. All other comparisons revealed highly significant differences (p<0.001) in statistical analysis (ANOVA followed by Newman-Keuls Multiple Comparison Test). **p<0.01; ***p<0.001; ns = not significant.
Figure 4
Figure 4. Alterations in TRAP1 levels influence [A53T]α-Synuclein-induced sensitivity to oxidative stress and mitochondrial effects in HEK293 cells.
HEK293 cells were transfected with plasmids promoting [A53T]α-Synuclein or TRAP1 expression. Empty vector transfection served as control. In addition, RNAi-mediated silencing of endogenous TRAP1 was induced (siTRAP1). Cells transfected with indicated plasmid combinations were treated with (A) hydrogen peroxide (100 µm) or (B) rotenone (200 µM) to induce oxidative stress. Cell numbers were analyzed to monitor survival. (C–E) HEK293 without oxidative stress treatment overexpressing the indicated proteins, or with RNAi-mediated silencing of TRAP1 were analyzed for (C) ATP production via Complex I, (D) total ATP content, and (E) mitochondrial membrane potential. Statistical analysis of displayed bar graphs was performed using ANOVA followed by Newman-Keuls Multiple Comparison Test. (A, B) Biologically relevant comparisons are indicated in bar graphs. (C) Differences compared to control are indicated. (A, B, C) A detailed summary of all comparisons is summarized in Figure S8. (D, E) Only cells with [A53T]α-Synuclein expression and TRAP1 reduction displayed significant differences in statistical analysis as indicated in graph. All other comparisons were not significant. *p<0.05; **p<0.01; ***p<0.001; ns = not significant.
Figure 5
Figure 5. Effect of TRAP1 mutation on modification of [A53T]α-Synuclein toxicity.
(A) Western blot analysis of HEK293 lysates transfected with indicated constructs showed similar expression levels of TRAP1[WT] and TRAP1[D158N] and a reduction of endogenous TRAP1 by siTRAP1. Blot was probed with TRAP1-specific antibody. ß-Actin served as loading control. (B, C) Effect of TRAP1[WT] and TRAP1[D158N] on [A53T]α-Synuclein-induced effects in HEK293 cells. (B) Effect of TRAP1[D158N] on [A53T]α-Synuclein-induced toxicity. Cell survival after rotenone (200 µM) treatment was monitored. Compared to TRAP1[WT], cells expressing TRAP1[D158N] displayed a significant reduction in survival (t-test, **p<0.01). (C) Assessment of ATP production via Complex I in unstressed cells with [A53T]α-Synuclein expression revealed a significant reduction of ATP levels in TRAP1[D158N] versus TRAP1[WT] expressing cells (t-test, ***p<0.001).
Figure 6
Figure 6. Inhibition of mitochondrial fusion by [A53T]α-Synuclein is rescued by TRAP1.
SH-SY5Y cells were co-transfected with the indicated constructs and mito-DsRed to visualize mitochondria. The mitochondrial morphology of transfected cells was analyzed by fluorescence microscopy. (A) Confocal images of representative cells displaying either an intact tubular mitochondrial network (control) or a fragmentation of this network (A53T). Co-expression of TRAP1[WT] prevented [A53T]α-Synuclein-induced mitochondrial fragmentation, whereas the TRAP1[D158N] mutant did not show rescue activity. Overexpression of either wild type or mutant TRAP1 alone did not influence mitochondrial morphology under steady state conditions. (B) For quantification, the mitochondrial morphology of at least 300 transfected cells per coverslip was determined in a blinded manner. Quantifications were based on triplicates of at least three independent experiments. Shown is the percentage of cells with fragmented mitochondria. (C) Expression levels of [A53T]α-Synuclein and TRAP1 were analyzed by Western blotting. β-Actin served as a loading control. ***p<0.001 (ANOVA).
Figure 7
Figure 7. Transient siRNA-mediated knockdown of TRAP1 increases [A53T]α-Synuclein-induced mitochondrial fragmentation.
SH-SY5Y cells were co-transfected with the siRNAs and plasmids indicated. Mitochondria were visualized by DsRed targeted to mitochondria (mito-DsRed). (A) Confocal images taken of representative cells displaying either an intact tubular mitochondrial network (control siRNA) or a fragmentation of the network (control siRNA+A53T). Transient knockdown of TRAP1 causes mitochondrial fragmentation itself (TRAP1 siRNA), additional co-expression of [A53T]α-Synuclein aggravated this phenotype and led to an overall increase in cells showing a fragmented mitochondrial network (TRAP1 siRNA+A53T). (B) For quantification, at least 300 transfected cells per coverslip were analyzed. The mitochondrial morphology was determined in a blinded manner. Quantifications are based on triplicates of three independent experiments. (C) Expression levels of [A53T]α-Synuclein and TRAP1 were analyzed by Western Blotting. β-Actin was used as a loading control. **p<0.01; ***p<0.001 (ANOVA).

References

    1. Mayeux R. Epidemiology of neurodegeneration. Annu Rev Neurosci. 2003;26:81–104. - PubMed
    1. Marsden CD. Neuromelanin and Parkinson's disease. J Neural Transm Suppl. 1983;19:121–141. - PubMed
    1. Lee FJ, Liu F. Genetic factors involved in the pathogenesis of Parkinson's disease. Brain Res Rev. 2008;58:354–364. - PubMed
    1. Keeney PM, Xie J, Capaldi RA, Bennett JP., Jr Parkinson's disease brain mitochondrial complex I has oxidatively damaged subunits and is functionally impaired and misassembled. J Neurosci. 2006;26:5256–5264. - PMC - PubMed
    1. Schapira AH, Cooper JM, Dexter D, Clark JB, Jenner P, et al. Mitochondrial complex I deficiency in Parkinson's disease. J Neurochem. 1990;54:823–827. - PubMed

Publication types

MeSH terms

LinkOut - more resources