

The empirical power of rare variant association methods: results from sanger sequencing in 1,998 individuals
- PMID: 22319458
- PMCID: PMC3271058
- DOI: 10.1371/journal.pgen.1002496
The empirical power of rare variant association methods: results from sanger sequencing in 1,998 individuals
Abstract
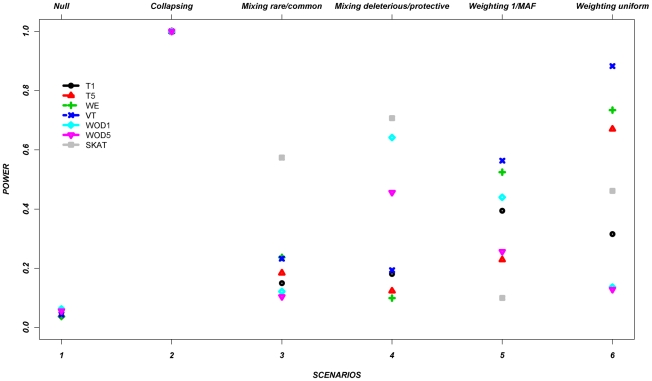
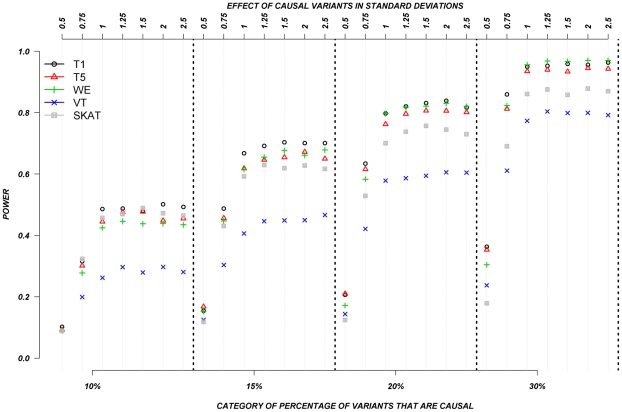
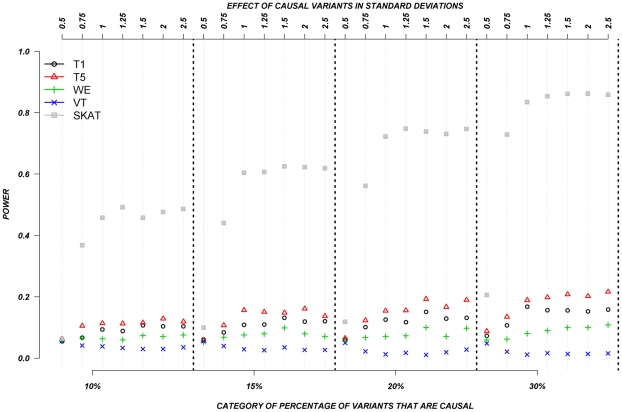
The role of rare genetic variation in the etiology of complex disease remains unclear. However, the development of next-generation sequencing technologies offers the experimental opportunity to address this question. Several novel statistical methodologies have been recently proposed to assess the contribution of rare variation to complex disease etiology. Nevertheless, no empirical estimates comparing their relative power are available. We therefore assessed the parameters that influence their statistical power in 1,998 individuals Sanger-sequenced at seven genes by modeling different distributions of effect, proportions of causal variants, and direction of the associations (deleterious, protective, or both) in simulated continuous trait and case/control phenotypes. Our results demonstrate that the power of recently proposed statistical methods depend strongly on the underlying hypotheses concerning the relationship of phenotypes with each of these three factors. No method demonstrates consistently acceptable power despite this large sample size, and the performance of each method depends upon the underlying assumption of the relationship between rare variants and complex traits. Sensitivity analyses are therefore recommended to compare the stability of the results arising from different methods, and promising results should be replicated using the same method in an independent sample. These findings provide guidance in the analysis and interpretation of the role of rare base-pair variation in the etiology of complex traits and diseases.
Conflict of interest statement
The authors have declared that no competing interests exist.
Figures
Comment in
-
Rare variants and the power of association.Nat Methods. 2012 Apr;9(4):324. doi: 10.1038/nmeth.1964. Nat Methods. 2012. PMID: 22563601 No abstract available.
References
-
- Liu DJ, Leal SM. A novel adaptive method for the analysis of next-generation sequencing data to detect complex trait associations with rare variants due to gene main effects and interactions. PLoS Genet. 2010;6:e1001156. doi: 10.1371/journal.pgen.1001156. - DOI - PMC - PubMed
-
- Cohen JC, Kiss RS, Pertsemlidis A, Marcel YL, McPherson R, et al. Multiple rare alleles contribute to low plasma levels of HDL cholesterol. Science. 2004;305:869–872. - PubMed
-
- Ionita-Laza I, Buxbaum JD, Laird NM, Lange C. A new testing strategy to identify rare variants with either risk or protective effect on disease. PLoS Genet. 2011;7:e1001289. doi: 10.1371/journal.pgen.1001289. - DOI - PMC - PubMed
Publication types
MeSH terms
Substances
Grants and funding
LinkOut - more resources
Full Text Sources
Miscellaneous
