. 2012;7(2):e31106.
doi: 10.1371/journal.pone.0031106. Epub 2012 Feb 2.

Start position strongly influences fixation patterns during face processing: difficulties with eye movements as a measure of information use

Affiliations

Start position strongly influences fixation patterns during face processing: difficulties with eye movements as a measure of information use

Joseph Arizpe et al. PLoS One. 2012.

Abstract

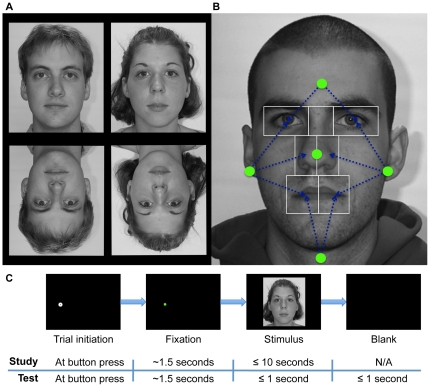
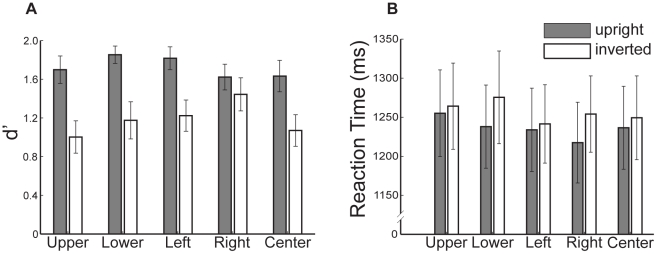
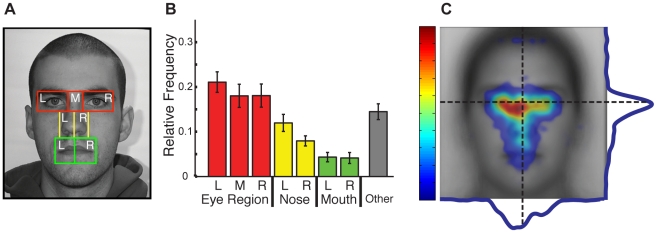
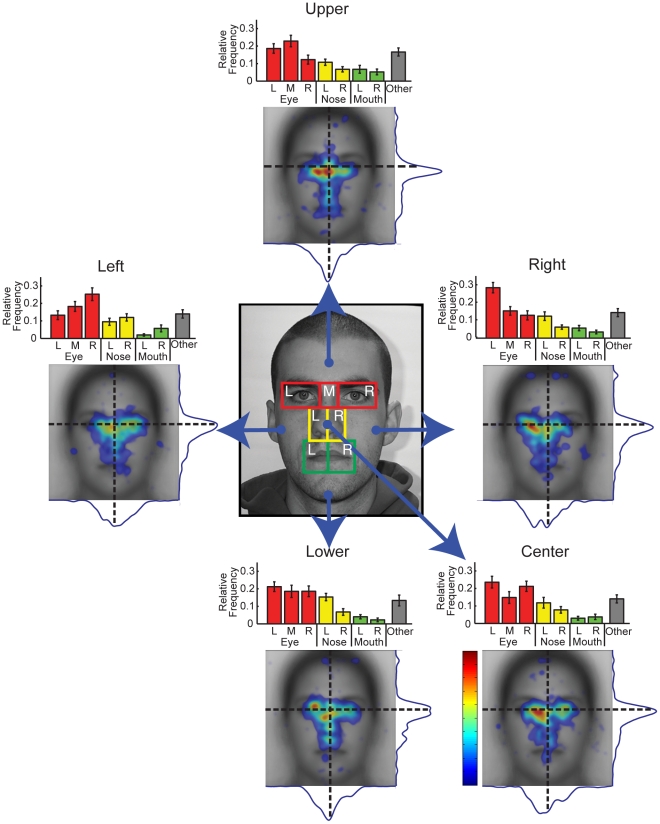
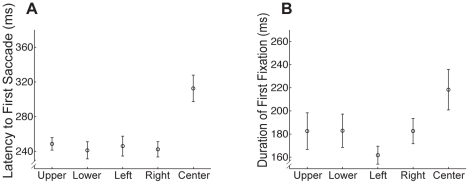
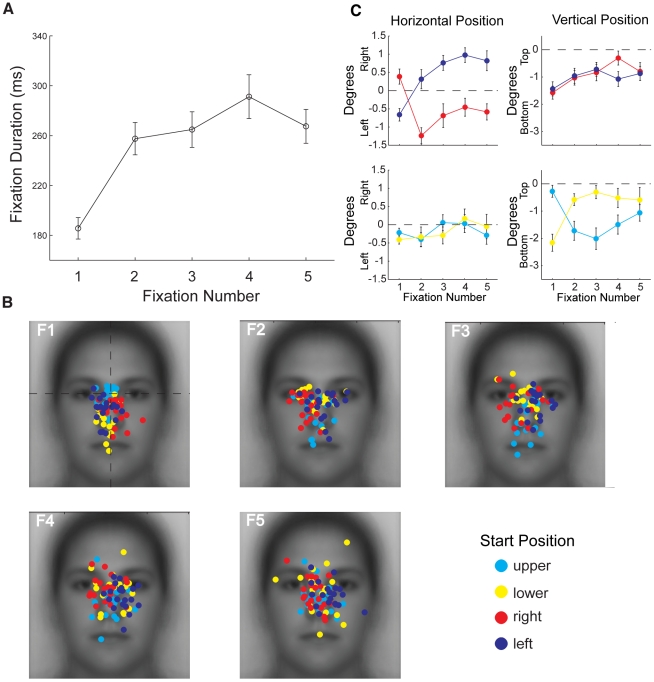
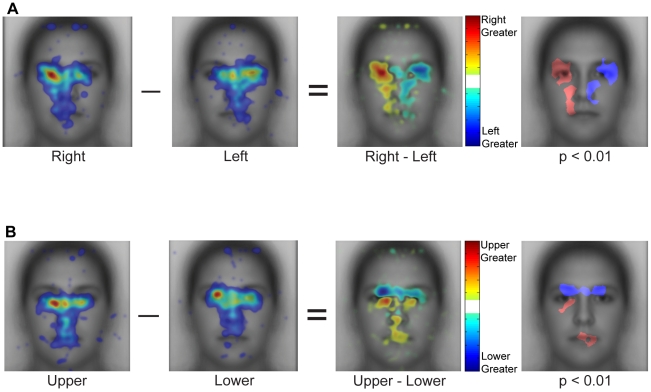
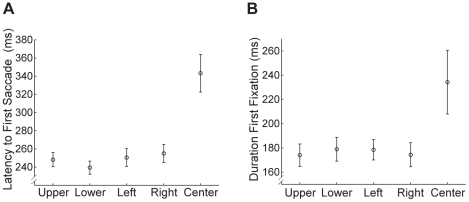
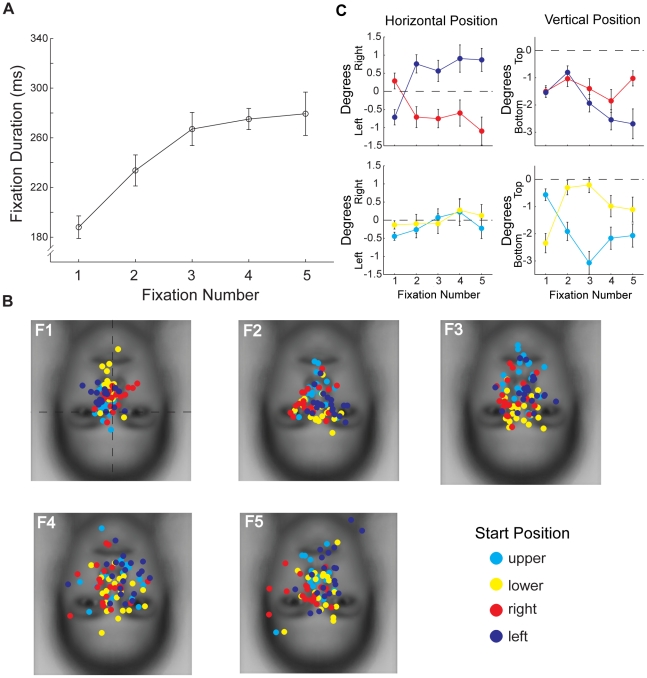
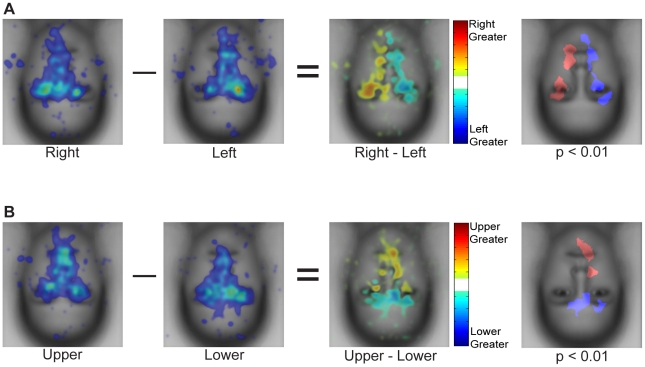
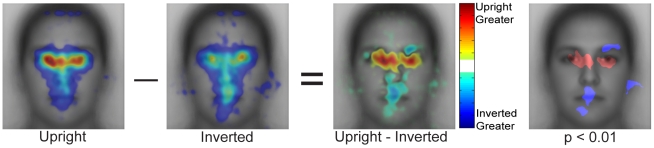
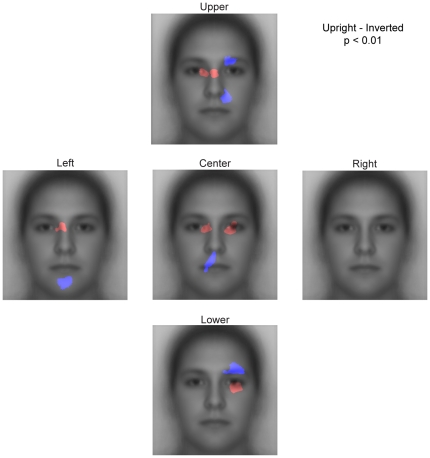
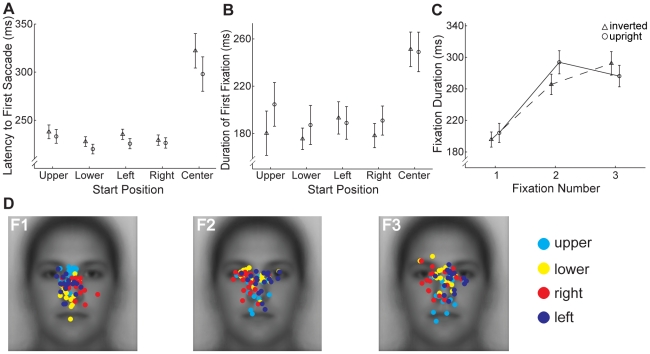
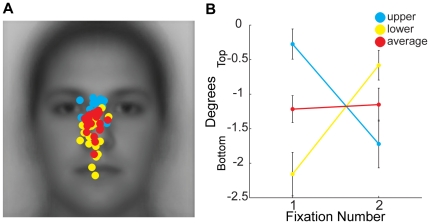
Fixation patterns are thought to reflect cognitive processing and, thus, index the most informative stimulus features for task performance. During face recognition, initial fixations to the center of the nose have been taken to indicate this location is optimal for information extraction. However, the use of fixations as a marker for information use rests on the assumption that fixation patterns are predominantly determined by stimulus and task, despite the fact that fixations are also influenced by visuo-motor factors. Here, we tested the effect of starting position on fixation patterns during a face recognition task with upright and inverted faces. While we observed differences in fixations between upright and inverted faces, likely reflecting differences in cognitive processing, there was also a strong effect of start position. Over the first five saccades, fixation patterns across start positions were only coarsely similar, with most fixations around the eyes. Importantly, however, the precise fixation pattern was highly dependent on start position with a strong tendency toward facial features furthest from the start position. For example, the often-reported tendency toward the left over right eye was reversed for the left starting position. Further, delayed initial saccades for central versus peripheral start positions suggest greater information processing prior to the initial saccade, highlighting the experimental bias introduced by the commonly used center start position. Finally, the precise effect of face inversion on fixation patterns was also dependent on start position. These results demonstrate the importance of a non-stimulus, non-task factor in determining fixation patterns. The patterns observed likely reflect a complex combination of visuo-motor effects and simple sampling strategies as well as cognitive factors. These different factors are very difficult to tease apart and therefore great caution must be applied when interpreting absolute fixation locations as indicative of information use, particularly at a fine spatial scale.


Conflict of interest statement

Competing Interests: The authors have declared that no competing interests exist.

Figures

Figure 1
Figure 1. Study design.
(a) Four example stimuli. Note that all faces were aligned to one another and scaled to be the same size. (b) Calculation of start positions. Start positions were determined separately for each face and were defined relative to the face. Left and right start positions were equidistant from centers of the nearest eye, nose and mouth AOIs. Upper and lower start positions were equidistant from the centers of the two eye or two mouth AOIs, respectively. (c) Trial sequences in study and test phases. A face was only presented if the participant successfully maintained fixation for a total of 1.5 seconds. After face onset in the study phase, participants were free to study the face for up to 10 seconds and pressed a button to begin the next trial. In the test phase, faces were presented for one second only and participants responded with button presses to indicate whether the face was ‘old’ or ‘new’.
Figure 2
Figure 2. Effects of face inversion on recognition.
(a) Face recognition, measured by d′, was significantly greater for upright than inverted faces. (b) Reaction time also showed an effect of inversion, with longer reaction times for inverted compared to upright faces. Error bars indicate the between-subjects standard error.
Figure 3
Figure 3. Distribution of fixations for upright faces averaged across start positions.
(a) Example of AOIs for one face. AOIs could be divided into three separate feature regions: eye (red), nose (yellow), and mouth (green). ‘L’, ‘M’ (eye region only), and ‘R’ refer to the left, middle, and right, respectively, of the facial feature regions. (b) Relative frequencies of fixations across AOIs for the first five fixations revealed more fixations to the eye region compared with the nose and mouth regions. Error bars indicate the between-subjects standard error. (c) Spatial density and profile plots for the first five fixations showing more fixations to the eye region with a tendency toward the left side of the face. The face plotted beneath the spatial density plot is the average of all faces after alignment. Fixations are plotted as Gaussian densities summed across trials and participants. Fixation density is indicated using a colorscale from zero to the maximum density value observed, with zero being transparent. Profile plots to the right and below the spatial density map are summations of the spatial densities across each dimension. The vertical dotted line indicates the midline of the average face. The horizontal dotted line indicates the vertical position of the center of the eyes.
Figure 4
Figure 4. Impact of start position on distribution of fixations for upright faces.
AOI, spatial density, and profile plots reveal a strong effect of start position on the distribution of fixations. For example, the overall tendency to one side of the face varies across start positions and switches from the left side of the face for the right start position to the right side of the face for the left start position. Fixation density in the heatmaps is indicated using a colorscale from zero to the maximum density value observed across the five heatmaps, with zero being transparent. Error bars indicate the between-subjects standard error.
Figure 5
Figure 5. Impact of start position on timing of initial saccades and fixations for upright faces.
(a) Average latency to first saccade by start position. Note the longer delay between face onset and the first saccade for the center compared to peripheral start positions. (b) Average duration of first fixation by start position. Note the longer fixation duration for the center compared to peripheral start positions. All error bars indicate the between-subjects standard error.
Figure 6
Figure 6. Evolution of fixations over ordinal number for upright faces.
(a) Average duration of each ordinal fixation. Note the much shorter duration of the first than subsequent fixations. (b) Distribution of individual participants' fixation locations broken down by start position for each ordinal fixation (F1–F5). Fixation locations for the first fixation were generally toward the center of the face, but with a relative tendency to fall closer to the start position. Fixation locations for subsequent fixations tended to fall on the side of the face opposite the start position. For example, on the first fixation, fixations for the left start position show a tendency to the left side of the face while those for the right start position show a tendency to the right side of the face. On subsequent fixations, these tendencies reverse with the right start position showing a tendency to the left side of the face and the left start position to the right side of the face. A similar effect can be observed for the upper and lower start positions. (c) Average locations from (b). The two left plots give the average horizontal position of fixations in degrees of visual angle relative to the midline of the face (dotted line). The two right plots give the average vertical position relative to the vertical position of the eyes (Figure 3b). Note the strong effect of the left and right start positions on horizontal but not vertical position (top panels) and the opposite effect for the upper and lower start positions (bottom panels). Error bars indicate the between-subjects standard error.
Figure 7
Figure 7. Direct comparison of spatial distributions of fixations for different start positions on upright faces.
(a) Right vs. left start position. The first two panels are the raw spatial density maps for fixations 2–5. The third panel shows the subtraction of these spatial density maps. The fourth panel plots those locations where that difference was significant (p<0.01) according to a Monte Carlo permutation test, which assumed exchangeability of fixations across contrasted start positions for each ordinal fixation. The map was cluster corrected (cluster threshold p<0.05, see methods). Note the significant advantage for the side of the face opposite the start position. (b) Same as (a) but for the upper and lower start positions. Note again the strong and significant advantage for the side of the face opposite the start position. Fixation density in the raw heatmaps is indicated using a colorscale from zero to the maximum density value observed across the heatmaps for start position, with zero being transparent. The difference in fixation density in contrast heatmaps is indicated using a colorscale from plus to minus the largest absolute difference observed across start position contrast maps.
Figure 8
Figure 8. Impact of start position on timing of initial saccades and fixations for inverted faces.
(a) Latency to first saccade. Note that the effect of start position was similar to that observed for upright faces with a longer latency for center compared to peripheral start positions (Figure 5a). (b) Duration of the first fixation. Again that the effect of start position was similar to that observed for upright faces with a longer fixation duration for center compared to peripheral start positions. All error bars indicate the between-subjects standard error.
Figure 9
Figure 9. Evolution of fixations over ordinal number for inverted faces.
(a) Average duration of each ordinal fixation. Note the much shorter duration of the first than subsequent fixations as was observed for upright faces. (b) Distribution of fixation locations across individual participants broken down by start position for each ordinal fixation (F1–F5). As for upright faces, fixation locations for the first fixation were generally toward the center of the face, but with a relative tendency to fall closer to the start position. Subsequent fixations locations tended to fall on the side of the face opposite the start position just as for upright faces. Note that all start positions are defined relative to the face. (c) Average locations from (b). Note the similar effects to those shown in Figure 6c. Error bars indicate the between-subjects standard error.
Figure 10
Figure 10. Direct comparison of spatial distributions of fixations for different start positions on inverted faces.
(a) Contrast between right and left start positions. All conventions are the same as in Figure 7. Note the symmetrical advantage for the side of face opposite the start position as with upright faces. (b) Contrast between upper and lower start positions. Note, again, the advantage for the side of the face opposite the start position.
Figure 11
Figure 11. Direct comparison of spatial distributions of fixations for upright and inverted faces.
The first two panels show the spatial density of fixations averaged across the peripheral start positions for upright and inverted faces, respectively. Note that there is greater variability in the location of fixations across the internal features for inverted than upright faces, but that the same general pattern holds. The third panel shows the subtraction of the first two panels and the fourth panel shows statistically significant differences. Overall, there are relatively more fixations to the eye region for upright compared to inverted faces and relatively fewer fixations to the mouth region. Fixation density in the raw heatmaps is indicated using a colorscale from zero to the maximum density value observed across the heatmaps pooling the peripheral start positions, with zero being transparent. The difference in fixation density in contrast heatmaps is indicated using a colorscale from plus to minus the largest absolute difference observed in the contrast map.
Figure 12
Figure 12. Impact of start position on the comparison of upright and inverted faces.
Statistically thresholded maps for the contrast between upright and inverted faces by start position. Regions with p<0.01 significance for upright faces are shown in red and those for inverted faces are shown in blue. At a coarse scale, the difference is consistent with more fixations to the eyes in upright and toward the lower part of the face in inverted. However, the precise location and extent, particularly of which part of the lower face accrues more fixations in inverted and which part of the eye region accrues more fixations in upright varies with start position.
Figure 13
Figure 13. Analysis of fixations during the test phase.
(a) Latency to first saccade by start position for upright and inverted faces. As for the study phase, there was a longer latency for the center start position compared with the peripheral start positions. (b) Duration of first fixation by start position for upright and inverted faces. Note the longer duration for the center start position, as observed during the study phase. (c) Duration of the first three fixations for the peripheral start locations for both upright and inverted faces. As for the study phase, the first fixation was significantly shorter than the subsequent fixations. All error bars indicate the between-subjects error. (d) Distribution of individual participants' fixation locations for upright faces broken down by start position for each fixation number (F1–F3). The same pattern was observed as during the study phase with first fixation close to the center of the face and subsequent fixations landing on the opposite side of the face to the start position.
Figure 14
Figure 14. The problem of averaging across start positions.
(a) First fixation locations across participants for the upper (blue) and lower (yellow) start positions for upright faces are replotted from Figure 6. The average location across these two start positions is plotted for each individual subject in red. Note that this averaging causes a regression to the center of face and obscures the tendency to fixate the side of face closest to the start location. Importantly, there is very little overlap in the distributions of fixation locations for the upper and lower start positions. (b) Average fixation locations, relative to the position of the eyes, in the vertical dimension for the upper and lower start positions for the first two fixations replotted from Figure 6. The average vertical location between these two start positions is plotted in red. Note that the average completely obscures the large shift in vertical bias between the first and second fixation. Error bars indicate the between-subjects error.

References

    1. Findlay J, Gilchrist I. Active Vision - The Psychology of Looking and Seeing. Oxford: Oxford University Press; 2003.
    1. Henderson JM. Human gaze control during real-world scene perception. Trends Cogn Sci. 2003;7:498–504. - PubMed
    1. Rayner K. Eye movements in reading and information processing: 20 years of research. Psychol Bull. 1998;124:372–422. - PubMed
    1. Just MA, Carpenter PA. A theory of reading: from eye fixations to comprehension. Psychol Rev. 1980;87:329–354. - PubMed
    1. Rayner K. Eye movements and landing positions in reading: a retrospective. Perception. 2009;38:895–899. - PubMed

Publication types