

Comparing pandemic to seasonal influenza mortality: moderate impact overall but high mortality in young children
- PMID: 22319616
- PMCID: PMC3272034
- DOI: 10.1371/journal.pone.0031197
Comparing pandemic to seasonal influenza mortality: moderate impact overall but high mortality in young children
Abstract
Background: We assessed the severity of the 2009 influenza pandemic by comparing pandemic mortality to seasonal influenza mortality. However, reported pandemic deaths were laboratory-confirmed - and thus an underestimation - whereas seasonal influenza mortality is often more inclusively estimated. For a valid comparison, our study used the same statistical methodology and data types to estimate pandemic and seasonal influenza mortality.
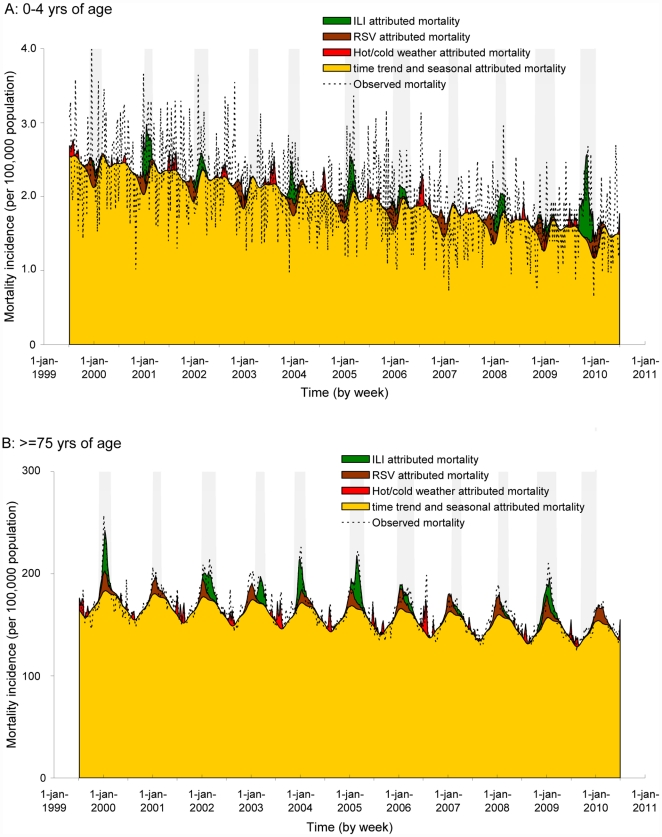
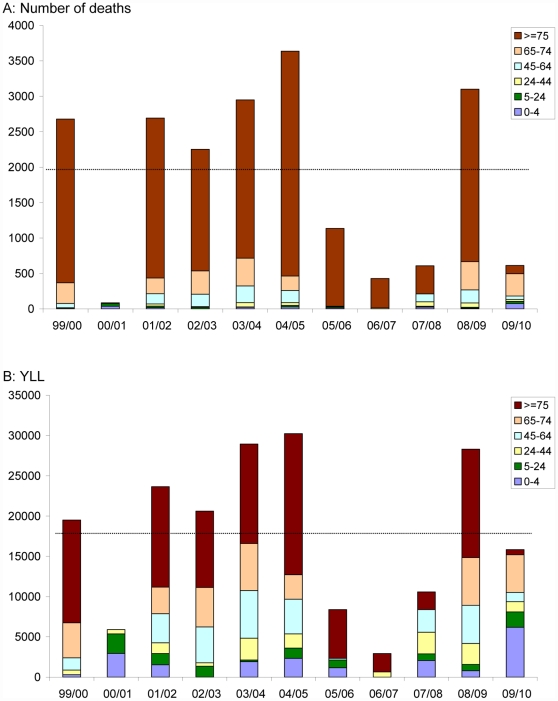
Methods and findings: We used data on all-cause mortality (1999-2010, 100% coverage, 16.5 million Dutch population) and influenza-like-illness (ILI) incidence (0.8% coverage). Data was aggregated by week and age category. Using generalized estimating equation regression models, we attributed mortality to influenza by associating mortality with ILI-incidence, while adjusting for annual shifts in association. We also adjusted for respiratory syncytial virus, hot/cold weather, other seasonal factors and autocorrelation. For the 2009 pandemic season, we estimated 612 (range 266-958) influenza-attributed deaths; for seasonal influenza 1,956 (range 0-3,990). 15,845 years-of-life-lost were estimated for the pandemic; for an average seasonal epidemic 17,908. For 0-4 yrs of age the number of influenza-attributed deaths during the pandemic were higher than in any seasonal epidemic; 77 deaths (range 61-93) compared to 16 deaths (range 0-45). The ≥75 yrs of age showed a far below average number of deaths. Using pneumonia/influenza and respiratory/cardiovascular instead of all-cause deaths consistently resulted in relatively low total pandemic mortality, combined with high impact in the youngest age category.
Conclusion: The pandemic had an overall moderate impact on mortality compared to 10 preceding seasonal epidemics, with higher mortality in young children and low mortality in the elderly. This resulted in a total number of pandemic deaths far below the average for seasonal influenza, and a total number of years-of-life-lost somewhat below average. Comparing pandemic and seasonal influenza mortality as in our study will help assessing the worldwide impact of the 2009 pandemic.
Conflict of interest statement
Figures
References
-
- WHO Pandemic (H1N1) 2009 - update 112. 06 Aug 2010. Available: http://www.who.int/csr/don/2010_08_06/en/index.html Accessed 2012 Jan 10.
-
- World Health Organization. Influenza Factsheet. Cited December 1st 2007. Available: http://www.who.int/mediacentre/factsheets/fs211/en/ Accessed 2012 Jan 10.
-
- Viboud C, Tam T, Fleming D, Handel A, Miller MA, et al. Transmissibility and mortality impact of epidemic and pandemic influenza, with emphasis on the unusually deadly 1951 epidemic. Vaccine. 2006;24:6701–6707. - PubMed
-
- Simonsen L, Reichert TA, Viboud C, Blackwelder WC, Taylor RJ, et al. Impact of influenza vaccination on seasonal mortality in the US elderly population. Arch Intern Med. 2005;165:265–272. - PubMed
Publication types
MeSH terms
LinkOut - more resources
Full Text Sources
Medical
