. 2011;37(4):721-47.
doi: 10.1111/j.1728-4457.2011.00454.x.

Population momentum across the demographic transition

Affiliations

Population momentum across the demographic transition

Laura Blue et al. Popul Dev Rev. 2011.

Abstract

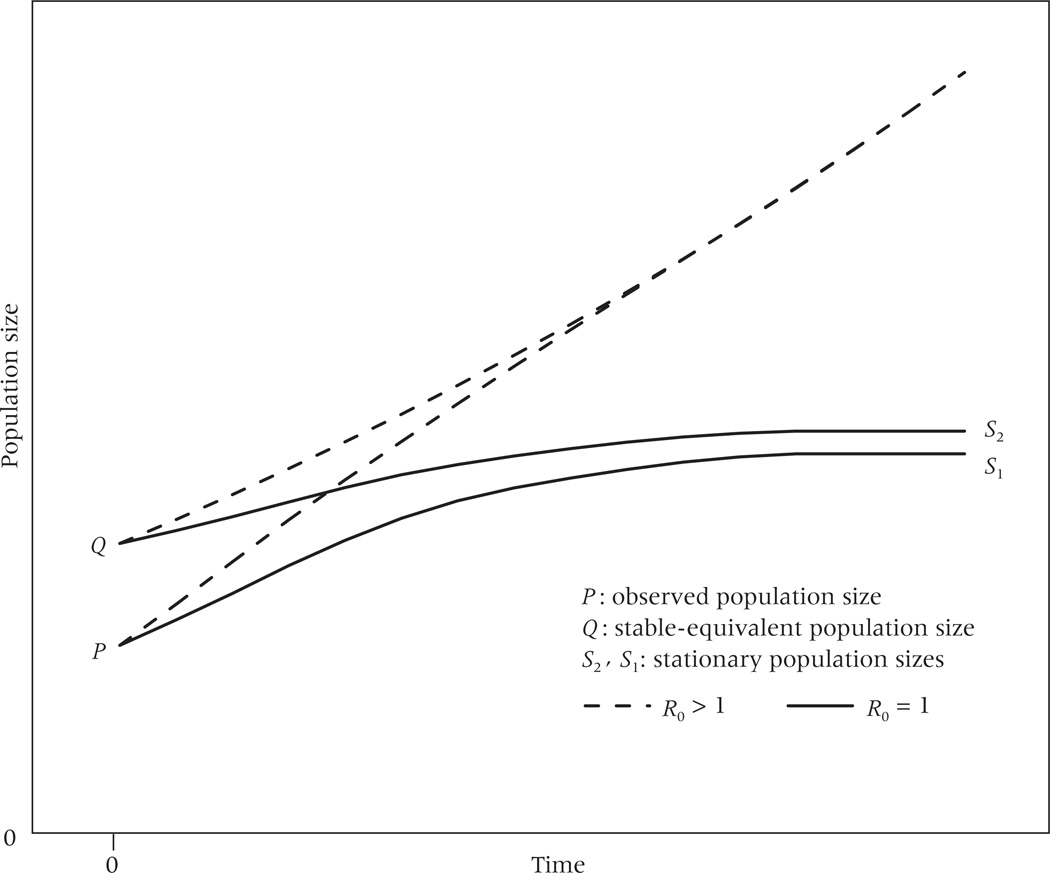
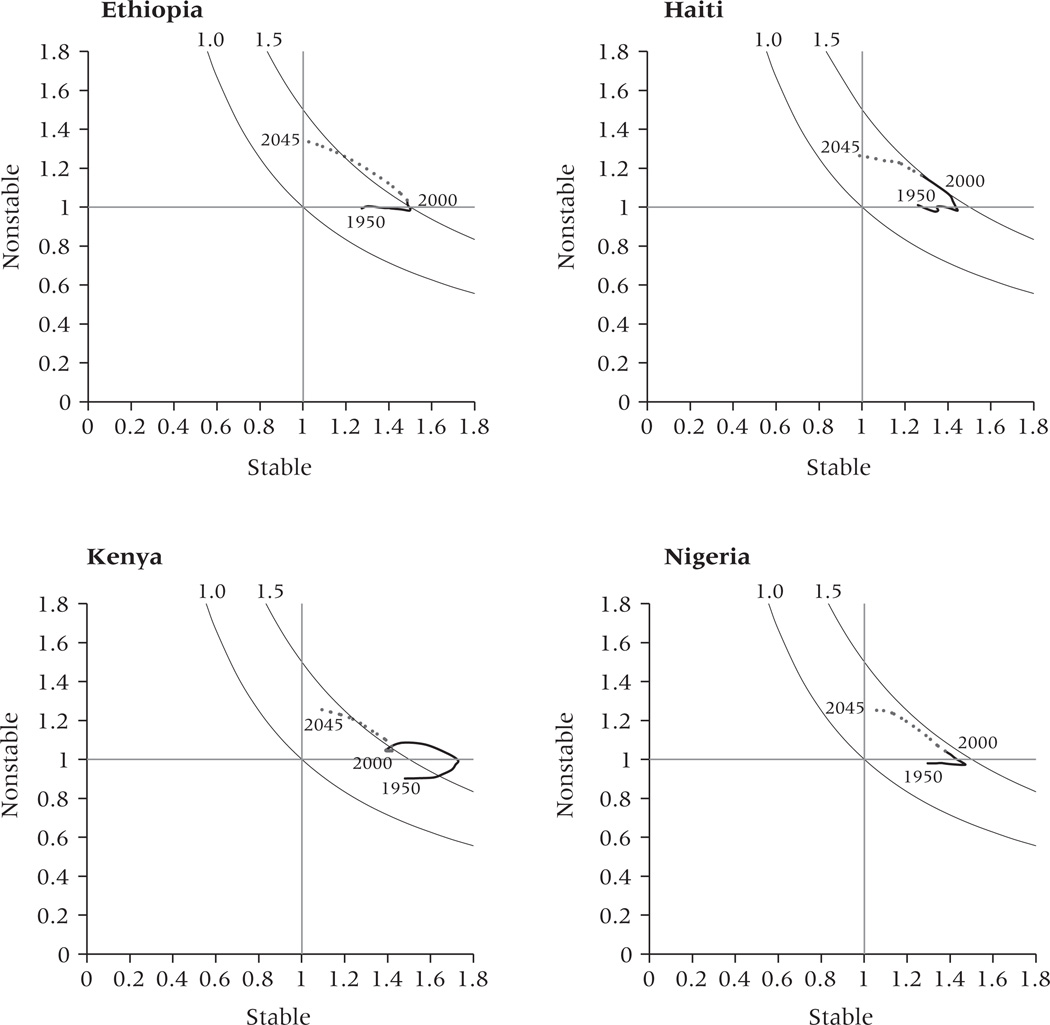
Population momentum is the main driver of global population growth today, and this makes an appreciation of momentum critical to understanding contemporary worldwide growth dynamics. This article traces population momentum along with two recently defined measures of momentum decomposed—stable and nonstable momentum—across the demographic transition. We use historical data and population projections from 16 countries to illustrate some previously ignored empirical regularities of the demographic transition in both the developed and the developing world. We also demonstrate the dynamic nature of stable and nonstable momentum, as changes in stable momentum lead to predictable changes in current and future nonstable momentum. These results suggest that momentum, which by definition is measured at a point in time, can also be considered as a process that unfolds over time.


Figures

FIGURE 1
FIGURE 1. Five stages of a stylized demographic transition
NOTE: Numbered stages represent 1. pre-transition, 2. early transition, 3. mid-transition (maximum rate of natural increase), 4. late transition, 5. second demographic transition.
FIGURE 2
FIGURE 2. Expected stable and nonstable population momentum across a stylized demographic transition in developed and developing countries
FIGURE 3
FIGURE 3. Calculating total, stable, and nonstable population momentum
NOTE: R0 is the net reproduction rate. SOURCE: Espenshade, Olgiati, and Levin (2011).
FIGURE 4
FIGURE 4. Total population momentum in four developing countries, stage 2 of the demographic transition, 1950–2045
NOTE: Dotted lines represent projected trends after 2005–2010.
FIGURE 5
FIGURE 5. Total population momentum in three developing countries, stage 3 of the demographic transition, 1950–2045
NOTE: Dotted lines represent projected trends after 2005–2010.
FIGURE 6
FIGURE 6. Total population momentum in four developing countries, stage 4 of the demographic transition, 1950–2045
NOTE: Dotted lines represent projected trends after 2005–2010.
FIGURE 7
FIGURE 7. Total population momentum in five developed countries, stage 5 of the demographic transition, 1751–2045
NOTE: Dotted lines represent projected trends after 2005–2010. aData for Belgium missing between 1915 and 1918.
FIGURE 8
FIGURE 8. Stable and nonstable population momentum in four developing countries, stage 2 of the demographic transition, 1950–2045
NOTE: Dotted lines represent projected trends after 2005–2010. The hyperbolic curves correspond to total momentum values of 1.0 and 1.5.
FIGURE 9
FIGURE 9. Stable and nonstable population momentum in three developing countries, stage 3 of the demographic transition, 1950–2045
NOTE: Dotted lines represent projected trends after 2005–2010. The hyperbolic curves correspond to total momentum values of 1.0 and 1.5.
FIGURE 10
FIGURE 10. Stable and nonstable population momentum in four developing countries, stage 4 of the demographic transition, 1950–2045
NOTE: Dotted lines represent projected trends after 2005–2010. The hyperbolic curves correspond to total momentum values of 1.0 and 1.5.
FIGURE 11
FIGURE 11. Stable and nonstable population momentum in Belgium, stage 5 of the demographic transition, 1841–2045a
NOTE: Dotted lines represent projected trends after 2005–2010. The hyperbolic curves correspond to total momentum values of 1.0 and 1.5. aData for Belgium missing between 1915 and 1918.
FIGURE 12
FIGURE 12. Stable and nonstable population momentum in Finland, stage 5 of the demographic transition, 1878–2045
NOTE: Dotted lines represent projected trends after 2005–2010. The hyperbolic curves correspond to total momentum values of 1.0 and 1.5.
FIGURE 13
FIGURE 13. Stable and nonstable population momentum in France, stage 5 of the demographic transition, 1816–2045
NOTE: Dotted lines represent projected trends after 2005–2010. The hyperbolic curves correspond to total momentum values of 1.0 and 1.5.
FIGURE 14
FIGURE 14. Stable and nonstable population momentum in Japan, stage 5 of the demographic transition, 1950–2045
NOTE: Dotted lines represent projected trends after 2005–2010. The hyperbolic curves correspond to total momentum values of 1.0 and 1.5.
FIGURE 15
FIGURE 15. Stable and nonstable population momentum in Sweden, stage 5 of the demographic transition, 1751–2045
NOTE: Dotted lines represent projected trends after 2005–2010. The hyperbolic curves correspond to total momentum values of 1.0 and 1.5.

References

    1. Bongaarts John. Population policy options in the developing world. Science. 1994;263(5148):771–776. - PubMed
    1. Bongaarts John. Population momentum. In: Andrew Mason, Merrick Thomas, Shaw Paul., editors. Population Economics, Demographic Transition, and Development: Research and Policy Implications. Washington, DC: IBRD/World Bank; 1999. pp. 3–15. World Bank Working Paper.
    1. Bongaarts John, Pelletier François, Gerland Patrick. Global trends in AIDS mortality. In: Richard Rogers, Crimmins Eileen., editors. International Handbook of Adult Mortality. Dordrecht, Netherlands: Springer; 2011. pp. 171–183.
    1. Bongaarts John, Watkins Susan Cotts. Social interactions and contemporary fertility transitions. Population and Development Review. 1996;22(4):639–682.
    1. Caldwell John C. Demographic Transition Theory. Dordrecht, Netherlands: Springer; 2006.

Publication types

MeSH terms

LinkOut - more resources