. 2012 Mar;103(3):422-32.
doi: 10.1111/j.1349-7006.2012.02206.x. Epub 2012 Feb 14.

Pericellular pH homeostasis is a primary function of the Warburg effect: inversion of metabolic systems to control lactate steady state in tumor cells

Affiliations

Pericellular pH homeostasis is a primary function of the Warburg effect: inversion of metabolic systems to control lactate steady state in tumor cells

Elizabeth A Mazzio et al. Cancer Sci. 2012 Mar.

Abstract

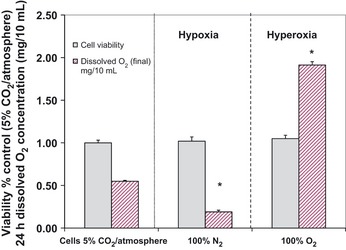
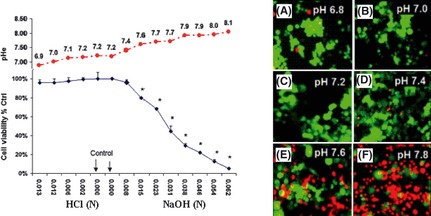
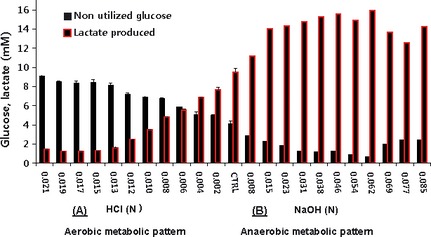
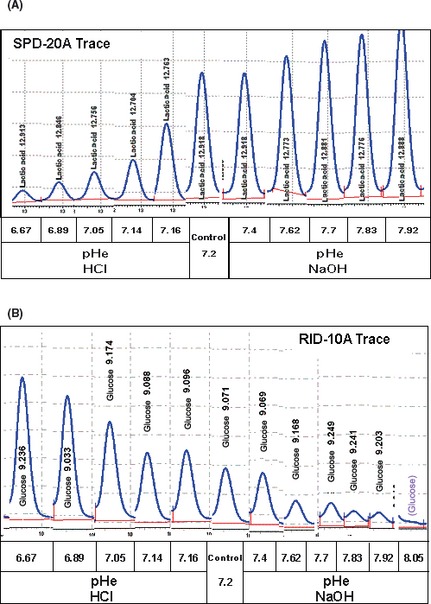
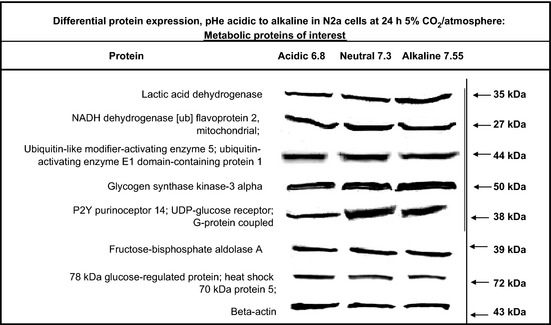
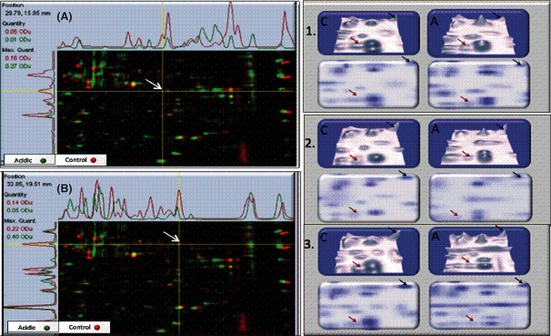
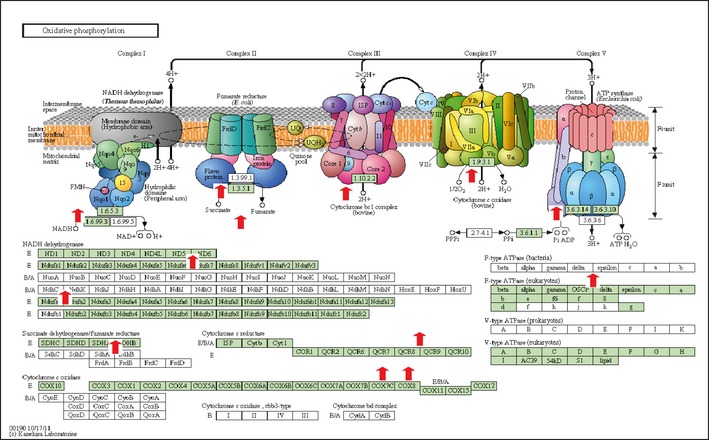
The Warburg effect describes a heightened propensity of tumor cells to produce lactic acid in the presence or absence of O(2) . A generally held notion is that the Warburg effect is related to energy. Using whole-genome, proteomic MALDI-TOF-MS and metabolite analysis, we investigated the Warburg effect in malignant neuroblastoma N2a cells. The findings show that the Warburg effect serves a functional role in regulating acidic pericellular pH (pHe), which is mediated by metabolic inversion or a fluctuating dominance between glycolytic-rate substrate level phosphorylation (SLP) and mitochondrial (mt) oxidative phosphorylation (OXPHOS) to control lactic acid production. The results also show that an alkaline pHe caused an elevation in SLP/OXPHOS ratio (approximately 98% SLP/OXPHOS); while the ratio was approximately 56% at neutral pHe and approximately 93% in acidic pHe. Acidic pHe paralleled greater expression of mitochondrial biogenesis and OXPHOS genes, such as complex III-V (Uqcr10, Atp5 and Cox7c), mt Fmc1, Romo1, Tmem 173, Tomm6, aldehyde dehydrogenase, mt Sod2 mt biogenesis component PPAR-γ co-activator 1 adjunct to loss of mt fission (Mff). Moreover, acidic pHe corresponded to metabolic efficiency evidenced by a rise in mTOR nutrient sensor GβL, its downstream target (Eif4ebp1), insulin modulators (Trib3 and Fetub) and loss of catabolic (Hadhb, Bdh1 and Pygl)/glycolytic processes (aldolase C, pyruvate kinase, Nampt and aldose-reductase). In contrast, alkaline pHe initiated loss of mitofusin 2, complex II-IV (Sdhaf1, Uqcrq, Cox4i2 and Aldh1l2), aconitase, mitochondrial carrier triple repeat 1 and mt biosynthetic (Coq2, Coq5 and Coq9). In conclusion, the Warburg effect might serve as a negative feedback loop that regulates the pHe toward a broad acidic range by altering lactic acid production through inversion of metabolic systems. These effects were independent of changes in O(2) concentration or glucose supply.


Figures

Figure 1
Figure 1
Toxicity profile of N2a cells in response to hyperoxia or hypoxia at a sustained pericellular pH 7.2. The data represent cell viability (% control) and dissolved O2 concentration (mg/10 mL) of the media after 24 h incubations at 37°C. Significance of difference between the control (5% CO2/atmosphere) and N 2 (hypoxic conditions) or O 2 (hyperoxic conditions) treated groups were determined by a one‐way anova followed by Tukey's post‐hoc test. *P < 0.01.
Figure 2
Figure 2
Toxicity profile of N2a cells in response to variation in pericellular pH (pHe) after 24 h incubation. The data represent viability (% control) (left panel) determined using almar blue assay and are presented as the mean ± SEM, n = 4. Corresponding pHe is presented and significance of difference between toxicity in controls versus treatment was determined by a one‐way anova followed by Tukey's post‐hoc test. *P < 0.01. Dual detection with fluorescence microscopy overlay was used as confirmation (right panel), where viable cells were imaged with fluorescein diacetate (green) and non‐viable cells using propidium iodide staining (red). pHe (A) 6.8, (B) 7.0, (C) 7.2, (D) 7.4, (E) 7.6 and (F) 7.8.
Figure 3
Figure 3
Effects of pericellular pH (pHe) on glucose to lactate conversion in N2a cells. The data represent lactic acid produced (mM) and glucose remaining (mM) (non‐utilized glucose) after 24‐h incubation at 5% CO2/atmosphere and are presented as the mean ± SEM (n = 4).
Figure 4
Figure 4
(A) Glycolytic lactate production in response to pericellular pH (pHe) shift from acidic to alkaline in N2a cells at 24 h. The data represent the raw data chart recording traces from the SPD‐20A UV detector (210 nm) quantifying lactic acid produced. (B) Glycolytic glucose remaining in response to pHe shift from acidic to alkaline in N2a cells at 24 h. The data represent the raw data chart recording traces from the RID‐10A 120 UV refractive index detector quantifying glucose remaining (consumed).
Figure 5
Figure 5
The effect of acidic pericellular pH (A) or alkaline pHe (B) on buffering capability of N2a at 24 h. The data represent the optical density for phenol red indicator dye over a wavelength scan 500–600 nm in media blanks (left panel), presence of cells (middle panel) and a 550 nm comparison for media blanks versus cell supernatant across pHe. The data are presented by the mean ± SEM, n = 4 (right panel).
Figure 6
Figure 6
Relative expression for basic proteins of interest in N2a cells cultured under diverse pHe acidic (approximately 6.8), neutral (approximately 7.3) and alkaline (approximately 7.55) for 24 h.
Figure 7
Figure 7
Multichannel (left) and 3‐D view (right) of aldolase C (A) (red arrows) and pyruvate kinase (B) (black arrows) exhibiting differential expression in N2a cells under pHe acidic (approximately 6.8) versus neutral controls (approximately 7.3).
Figure 8
Figure 8
KEGG pathway mapping overlay for acidic pHe upregulated genes pertinent to OXPHOS. The data represent differential expression profiles specific to mitochondrial respiratory function for N2a cells cultured under pHe acidic (approximately 6.8) versus alkaline (approximately 7.55) for 24 h.

References

    1. Champion L, Brain E, Giraudet AL et al Breast cancer recurrence diagnosis suspected on tumor marker rising: value of whole‐body 18FDG‐PET/CT imaging and impact on patient management. Cancer 2011; 117: 1621–9. - PubMed
    1. Serganova I, Rizwan A, Ni X et al Metabolic imaging: a link between lactate dehydrogenase A, lactate, and tumor phenotype. Clin Cancer Res 2011; 17: 6250–61. - PMC - PubMed
    1. Mentis AF, Kararizou E. Metabolism and cancer: an up‐to‐date review of a mutual connection. Asian Pac J Cancer Prev 2010; 11: 1437–44. - PubMed
    1. Shapovalov Y, Hoffman D, Zuch D, de Mesy Bentley KL, Eliseev RA. Mitochondrial dysfunction in cancer cells due to aberrant mitochondrial replication. J Biol Chem 2011; 286: 22331–8. - PMC - PubMed
    1. Smerc A, Sodja E, Legisa M. Posttranslational modification of 6‐phosphofructo‐1‐kinase as an important feature of cancer metabolism. PLoS ONE 2011; 6: e19645. - PMC - PubMed

Publication types

MeSH terms