

Automated teniae coli detection and identification on computed tomographic colonography
- PMID: 22320805
- PMCID: PMC3281971
- DOI: 10.1118/1.3679013
Automated teniae coli detection and identification on computed tomographic colonography
Abstract
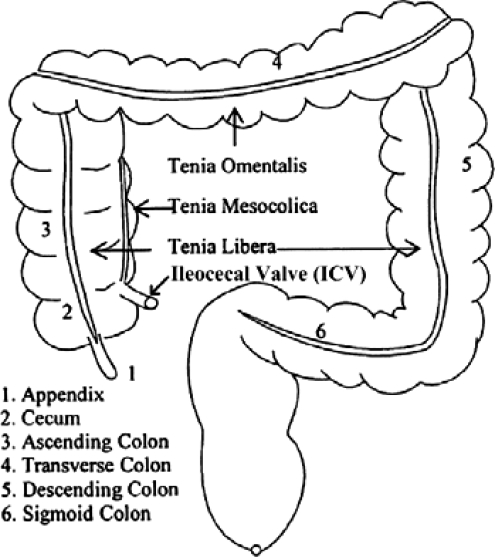
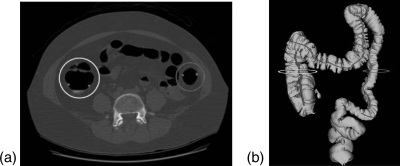
Purpose: Computed tomographic colonography (CTC) is a minimally invasive technique for colonic polyps and cancer screening. Teniae coli are three bands of longitudinal smooth muscle on the colon surface. Teniae coli are important anatomically meaningful landmarks on human colon. In this paper, the authors propose an automatic teniae coli detection method for CT colonography.
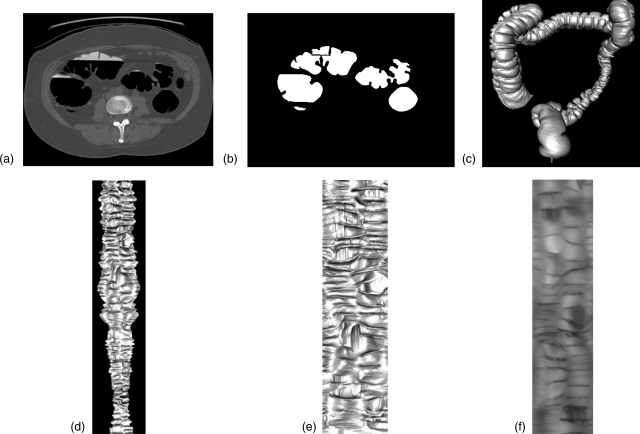
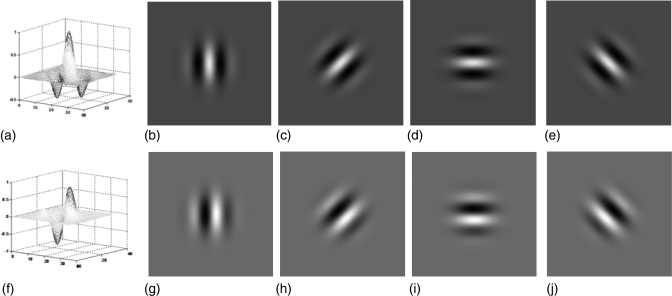
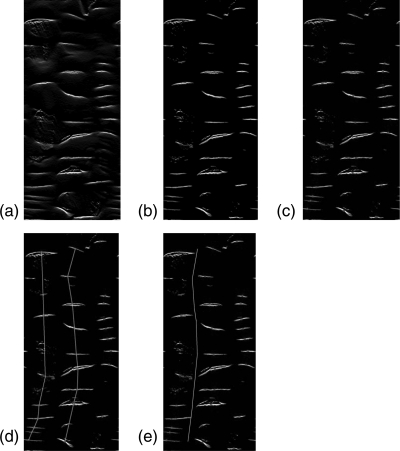
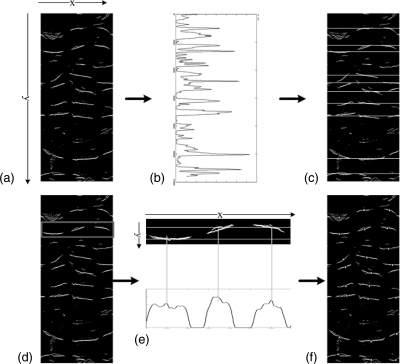
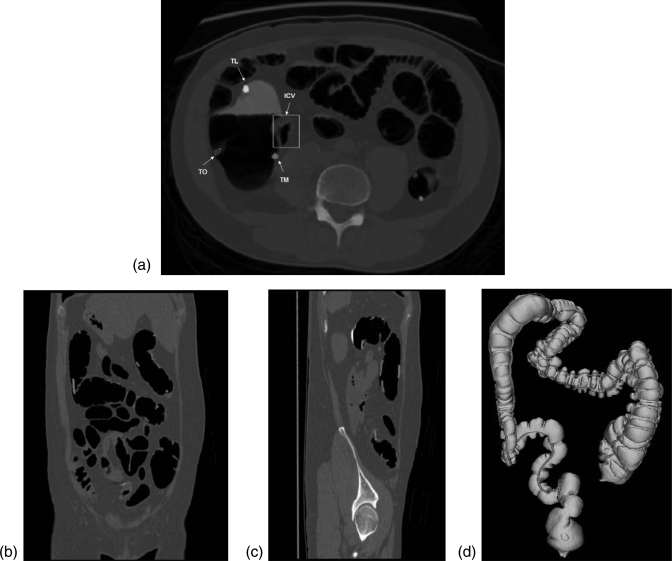
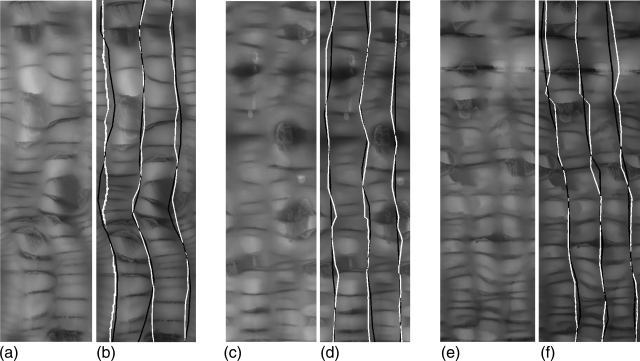
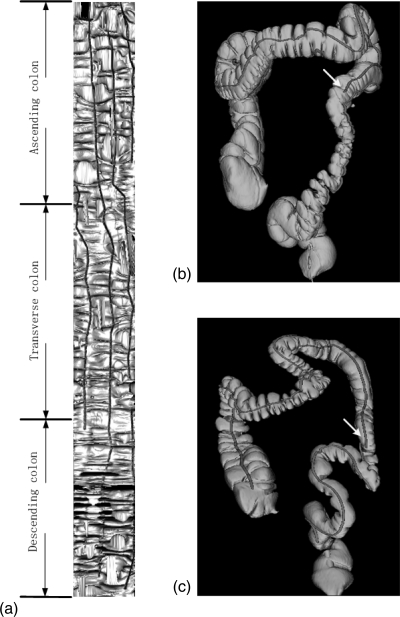
Methods: The original CTC slices are first segmented and reconstructed to a 3D colon surface. Then, the 3D colon surface is unfolded using a reversible projection technique. After that the unfolded colon is projected to a 2D height map. The teniae coli are detected using the height map and then reversely projected back to the 3D colon. Since teniae are located at the junctions where the haustral folds meet, the authors apply 2D Gabor filter banks to extract features of haustral folds. The maximum response of the filter banks is then selected as the feature image. The fold centers are then identified based on local maxima and thresholding on the feature image. Connecting the fold centers yields a path of the folds. Teniae coli are extracted as lines running between the fold paths. The authors used the spatial relationship between ileocecal valve (ICV) and teniae mesocolica (TM) to identify the TM, then the teniae omentalis (TO) and the teniae libera (TL) can be identified subsequently.
Results: The authors tested the proposed method on 47 cases of 37 patients, 10 of the patients with both supine and prone CT scans. The proposed method yielded performance with an average normalized root mean square error (RMSE) ( ± standard deviation [95% confidence interval]) of 4.87% ( ± 2.93%, [4.05% 5.69%]).
Conclusions: The proposed fully-automated teniae coli detection and identification method is accurate and promising for future clinical applications.
Figures

Similar articles
-
Feasibility of using the marginal blood vessels as reference landmarks for CT colonography.AJR Am J Roentgenol. 2014 Jan;202(1):W50-8. doi: 10.2214/AJR.12.10463. AJR Am J Roentgenol. 2014. PMID: 24370165 Free PMC article.
-
Teniae coli-based circumferential localization system for CT colonography: feasibility study.Radiology. 2007 May;243(2):551-60. doi: 10.1148/radiol.2432060353. Radiology. 2007. PMID: 17456877 Clinical Trial.
-
Mixture of expert 3D massive-training ANNs for reduction of multiple types of false positives in CAD for detection of polyps in CT colonography.Med Phys. 2008 Feb;35(2):694-703. doi: 10.1118/1.2829870. Med Phys. 2008. PMID: 18383691
-
Automated image-based colon cleansing for laxative-free CT colonography computer-aided polyp detection.Med Phys. 2011 Dec;38(12):6633-42. doi: 10.1118/1.3662918. Med Phys. 2011. PMID: 22149845 Free PMC article.
-
Computer-aided diagnosis for CT colonography.Semin Ultrasound CT MR. 2004 Oct;25(5):419-31. doi: 10.1053/j.sult.2004.07.002. Semin Ultrasound CT MR. 2004. PMID: 15559125 Review.
Cited by
-
Associations among pericolonic fat, visceral fat, and colorectal polyps on CT colonography.Obesity (Silver Spring). 2015 Feb;23(2):408-14. doi: 10.1002/oby.20987. Epub 2014 Dec 31. Obesity (Silver Spring). 2015. PMID: 25558027 Free PMC article.
-
Feasibility of using the marginal blood vessels as reference landmarks for CT colonography.AJR Am J Roentgenol. 2014 Jan;202(1):W50-8. doi: 10.2214/AJR.12.10463. AJR Am J Roentgenol. 2014. PMID: 24370165 Free PMC article.
-
Is it possible to give a single definition of the rectosigmoid junction?Surg Radiol Anat. 2018 Apr;40(4):431-438. doi: 10.1007/s00276-017-1954-4. Epub 2017 Dec 7. Surg Radiol Anat. 2018. PMID: 29218384 Review.
References
-
- Pickhardt P. J., Choi J. R., Hwang I., Butler J. A., Puckett M. L., Hildebrandt H. A., Wong R. K., Nugent P. A., Mysliwiec P. A., and Schindler W. R., “Computed tomographic virtual colonoscopy to screen for colorectal neoplasia in asymptomatic adults,” N. Engl. J. Med. 349, 2191–2200 (2003).10.1056/NEJMoa031618 - DOI - PubMed
-
- Paik D. S., Beaulieu C. F., Rubin G. D., Acar B., Jeffrey R. B., Yee J., Dey J., and Napel S., “Surface normal overlap: A computer-aided detection algorithm, with application to colonic polyps and lung nodules in helical CT,” IEEE Trans. Med. Imaging 23, 661–675 (2004).10.1109/TMI.2004.826362 - DOI - PubMed
Publication types
MeSH terms
Grants and funding
LinkOut - more resources
Full Text Sources
Medical
