. 2012 Feb;39(2):1102-11.
doi: 10.1118/1.3679856.

Comparisons of treatment optimization directly incorporating systematic patient setup uncertainty with a margin-based approach

Affiliations

Comparisons of treatment optimization directly incorporating systematic patient setup uncertainty with a margin-based approach

Joseph A Moore et al. Med Phys. 2012 Feb.

Abstract

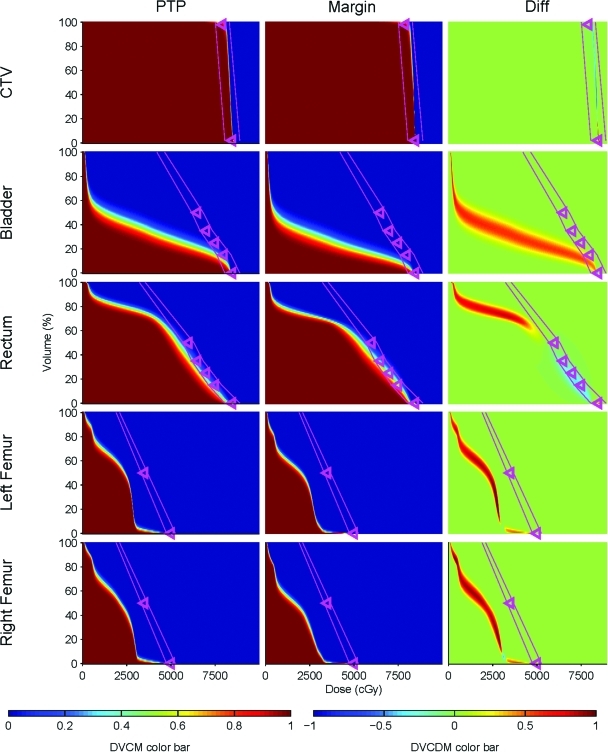
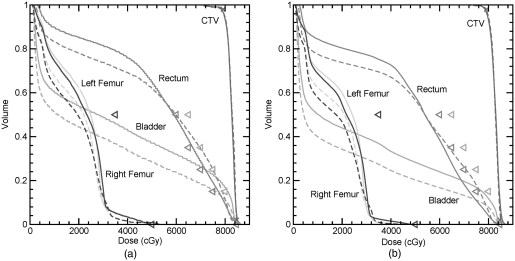
Purpose: To develop a probabilistic treatment planning (PTP) method which is robust to systematic patient setup errors and to compare PTP plans with plans generated using a planning target volume (PTV) margin optimized to give the same target coverage probability as the PTP plan.

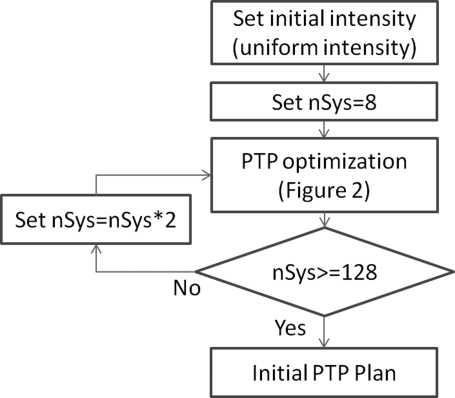
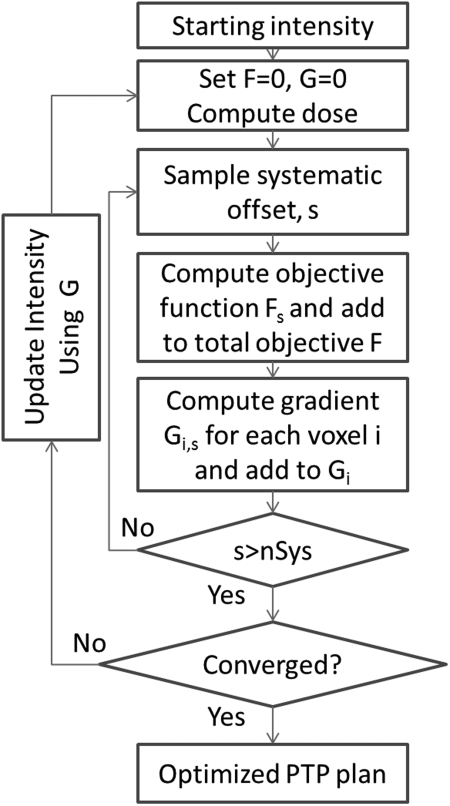
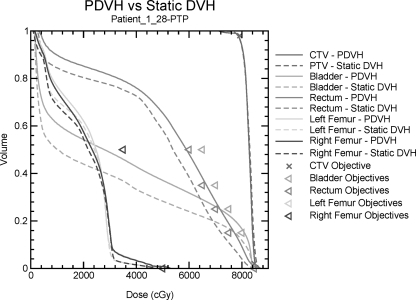
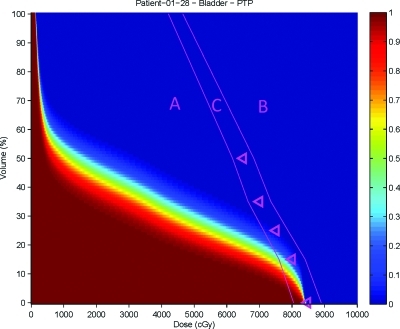
Methods: Plans adhering to the RTOG-0126 protocol are developed for 28 prostate patients using PTP and margin-based planning. For PTP, an objective function that simultaneously considers multiple possible patient positions is developed. PTP plans are optimized using clinical target volume (CTV) structures and organ at risk (OAR) structures. The desired CTV coverage probability is 95%. Plans that cannot achieve a 95% CTV coverage probability are re-optimized with a desired CTV coverage probability reduced by 5% until the desired CTV coverage probability is achieved. Margin-based plans are created which achieve the same CTV coverage probability as the PTP plans by iterative adjustment of the CTV-to-PTV margin. Postoptimization, probabilistic dose-volume coverage metrics are used to compare the plans.

Results: For equivalent target coverage probability, PTP plans significantly reduce coverage probability for rectum objectives (-17% for D(35) < 65 Gy, p = 0.0010; -23% for D(25) < 70 Gy, p < 0.0001; and -27% for D(15) < 75 Gy, p < 0.0001). Physician assessment indicates PTP plans are entirely preferred 71% of the time while margin-based plans are entirely preferred 7% of the time.

Conclusions: For plans having the same target coverage probability, PTP has potential to reduce rectal doses while maintaining CTV coverage probability. In blind comparisons, physicians prefer PTP plans over optimized margin plans.


Figures

Figure 1
Figure 1
Process for generating the initial PTP plan. nSys is the number of systematic shifts used during the PTP optimization process.
Figure 2
Figure 2
PTP Process to generate an optimized plan accounting for systematic uncertainty. F is the total objective score, G is the total gradient matrix containing the first derivative of the objective function Gi for each voxel i. Fs is the objective function score for shift s.
Figure 3
Figure 3
Static DVH and PDVH curves for the CTV, bladder, rectum, left femur, and right femur for the PTP generated for Patient 1. Solid lines represent PDVH curves and dashed lines represent static DVH. Objectives used during optimization are given as triangles.
Figure 4
Figure 4
Regions of a DVCM. Region A is below the plan objectives, Region B is above the plan objectives, and Region C is the intermediate area near the plan objectives.
Figure 5
Figure 5
DVCMs and DVCDMs for the CTV, bladder, rectum, and femur for Patient 1. The DVCM indicates the probability that the dose-volume level is achieved in a given treatment course. Triangles on the DVCM indicate the dose-volume planning objectives used during plan optimization. The DVCDM compares the PTP and the margin-based plans. Values less than zero (blue regions) indicate lower doses by the PTP plan compared with the margin plan. Values greater than zero (red regions) indicate higher doses by the PTP plan. The pink lines differentiate the regions as shown in Fig. 4 .
Figure 6
Figure 6
(a) Probability dose-volume histogram for the 95% percentile DVH for the CTV and 5% DVH for the bladder, rectum, and femurs for PTP and margin-based plans. (b) Static dose-volume histograms for the CTV, bladder, rectum, left femur, and right femur for PTP and margin-based plans. Solid lines represent PDVH curves for the PTP plan and dashed lines represent the margin-based plan. Objectives used during optimization are given as triangles.

Similar articles

Cited by

References

    1. International Commission on Radiation Units and Measurements., Prescribing, Recording, and Reporting Photon Beam Therapy (International Commission on Radiation Units and Measurements, Bethesda, Md., 1999).
    1. International Commission on Radiation Units and Measurements., Prescribing, Recording, and Reporting Photon Beam Therapy (International Commission on Radiation Units and Measurements, Bethesda, MD, 1993).
    1. van Herk M., “Errors and margins in radiotherapy,” Semin. Radiat. Oncol. 14, 52–64 (2004).10.1053/j.semradonc.2003.10.003 - DOI - PubMed
    1. van Herk M., Remeijer P., and Lebesque J. V., “Inclusion of geometric uncertainties in treatment plan evaluation,” Int. J. Radiat. Oncol. Biol. Phys. 52, 1407–1422 (2002).10.1016/S0360-3016(01)02805-X - DOI - PubMed
    1. van Herk M., Remeijer P., Rasch C., and Lebesque J. V., “The probability of correct target dosage: dose-population histograms for deriving treatment margins in radiotherapy,” Int. J. Radiat. Oncol. Biol. Phys. 47, 1121–1135 (2000).10.1016/S0360-3016(00)00518-6 - DOI - PubMed

Publication types