. 2012 Apr;103(4):723-30.
doi: 10.1111/j.1349-7006.2012.02218.x. Epub 2012 Mar 4.

Adenovirus-mediated gene transfer of tissue factor pathway inhibitor-2 inhibits gallbladder carcinoma growth in vitro and in vivo

Affiliations

Adenovirus-mediated gene transfer of tissue factor pathway inhibitor-2 inhibits gallbladder carcinoma growth in vitro and in vivo

Yiyu Qin et al. Cancer Sci. 2012 Apr.

Abstract

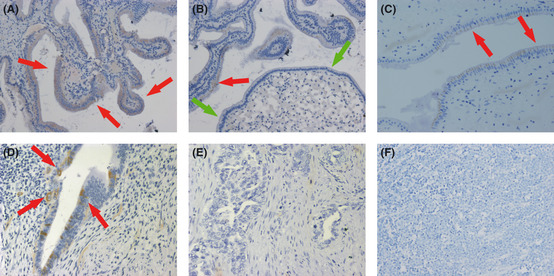
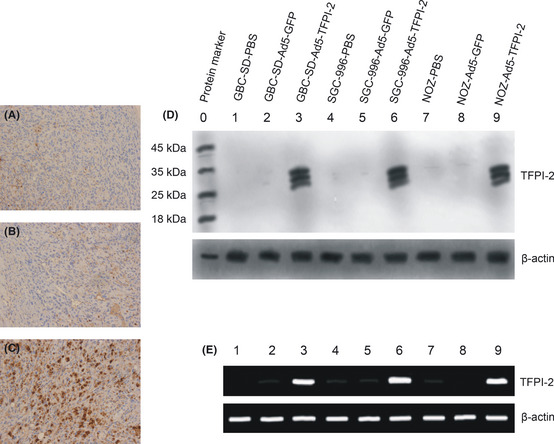
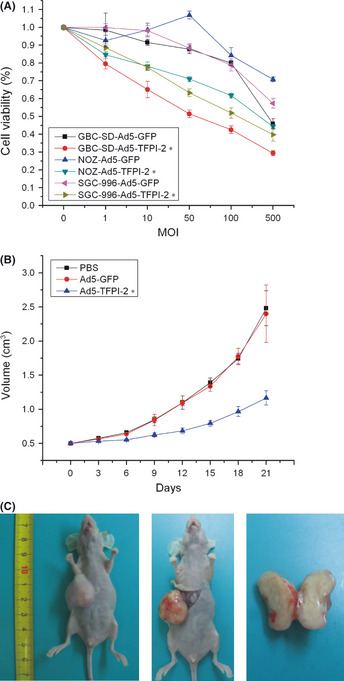
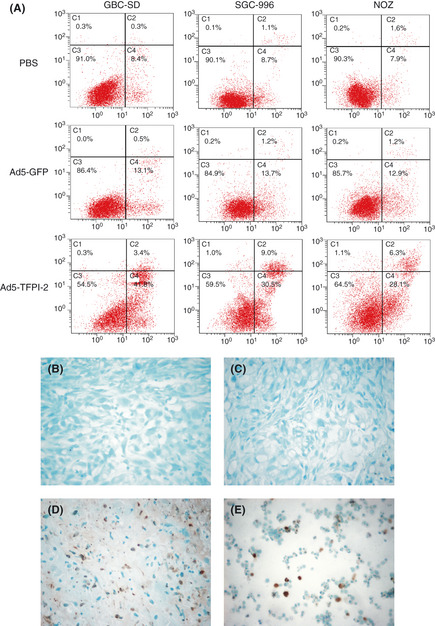
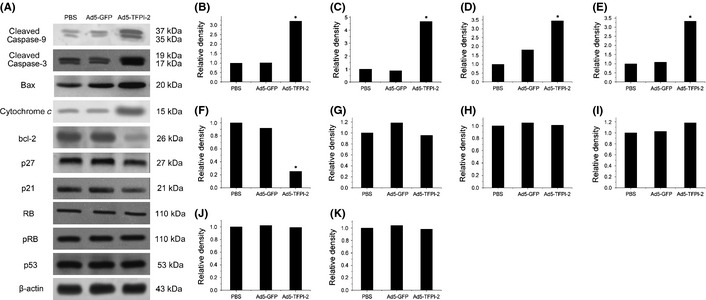
Tissue factor pathway inhibitor-2 (TFPI-2) has been identified as a tumor suppressor gene in several types of cancers, but its role in gallbladder carcinoma (GBC) is yet to be determined. In the present study, TFPI-2 expression in GBC tissues was examined, and its inhibitory activities against GBC growth were evaluated in vitro and in vivo after adenovirus-mediated gene transfer of TFPI-2 (Ad5-TFPI-2) was constructed to restore the expression of TFPI-2 in GBC cell lines (GBC-SD, SGC-996, NOZ) and xenograft tumors. Immunohistochemical staining showed that TFPI-2 was significantly downregulated in GBC tissue specimens. Ad5-TFPI-2 could significantly inhibit GBC growth both in vitro and in vivo. Apoptosis analysis and western blotting assay demonstrated that Ad5-TFPI-2 could induce the apoptosis of both GBC cell lines and tissues by promoting the activities of cytochrome c, Bax, caspase-3 and -9 and suppressing Bcl-2 activity. These data indicated that TFPI-2 acts as a tumor suppressor in GBC, and may have a potential role in gene therapy for GBC.


Figures

Figure 1
Figure 1
Expression of tissue factor pathway inhibitor‐2 (TFPI‐2) in gallbladder carcinoma (GBC) tissues, lymph metastasis, normal tissues, and gallbladder polyp (GBP) tissues by immunohistochemical staining (×200). The percentage of positive‐stained epithelial cells or cancer cells with >10% were considered as positive. Red arrow represents positive expression, and green arrow represents negative expression. (A) TFPI‐2 expression in normal tissues. TFPI‐2 staining was located in the cytoplasm of epithelial cells. (B) TFPI‐2 expression was detected in epithelial cells of normal tissue but not in those of GBP tissues. (C) TFPI‐2 expression was also detected in epithelial cells of GBP tissues. (D) TFPI‐2 expression was detected in cancer cells of GBC tissues. (E) TFPI‐2 expression was not detected in cancer cells of GBC tissues. (F) TFPI‐2 expression was not detected in cancer cells of lymph metastasis.
Figure 2
Figure 2
Adenovirus‐mediated gene transfer of tissue factor pathway inhibitor‐2 (Ad5‐TFPI‐2) restored TFPI‐2 expression in gallbladder carcinoma (GBC) cell lines and xenograft tumors. (A) TFPI‐2 was weakly expressed in xenograft tumor tissues treated with phosphate‐buffered saline (PBS) (×200). (B) TFPI‐2 was weakly expressed in xenograft tumor tissues treated with Ad5‐GFP. (C) TFPI‐2 expression was detected in xenograft tumor tissues treated with Ad5‐TFPI‐2. (D) Western blotting analysis showed that TFPI‐2 protein was detected in Ad5‐TFPI‐2 group (lane 3, 6, 9). All TFPI‐2 containing fractions consisted of three differentially glycosylated molecular weight species (33, 31 and 27 kd). But none was observed in control groups (lane 1, 2, 4, 5, 7, 8). (E) The polymerase chain reaction (PCR) products of TFPI‐2 and β‐actin were 194 and 161 bp in length, respectively. TFPI‐2 mRNA was detected in Ad5‐TFPI‐2 group (lane 3, 6, 9), whereas, the target bands were hardly seen in PBS group (lane 1, 4, 7) or Ad5‐GFP group (lane 2, 5, 8). The lanes were designated the same as (D).
Figure 3
Figure 3
Adenovirus‐mediated gene transfer of tissue factor pathway inhibitor‐2 (Ad5‐TFPI‐2) inhibited gallbladder carcinoma (GBC) growth in vitro and in vivo. Asterisk (*) indicates significant difference. (A) Cell viability was measured by WST‐1 assay. Ad5‐TFPI‐2 exhibited a dose‐dependent anti‐proliferative activity against all three GBC cell lines. Cell proliferation was significantly inhibited in Ad5‐TFPI‐2 group when compared to control groups (P = 0.000, one‐way anova). (B) Volumes of xenograft tumors (cm3) were measured after death. Volume = length × width2/2. Tumor volumes in Ad5‐TFPI‐2 group were much smaller than those of control groups (P = 0.000, one‐way anova). (C) Xenograft tumors were collected and the volumes were measured.
Figure 4
Figure 4
Apoptosis in gallbladder carcinoma (GBC) cell lines and tissues was evaluated by Annexin VAPC/PI assay (A) and terminal deoxynucleotidyl transferase‐mediated dUTP nick end labeling (TUNEL) assay (B,C,D), respectively. (A) Adenovirus‐mediated gene transfer of tissue factor pathway inhibitor‐2 (Ad5‐TFPI‐2) induced apoptosis in all three GBC cell lines (P = 0.000). Cell apoptosis was examined by using Annexin V and propidium iodide (PI) staining. X‐axis represents Annexin V fluorescence intensity and Y‐axis represents PI fluorescence intensity. Cells that stain positive for Annexin V and negative for PI are undergoing apoptosis (lower right). Cells that stain positive for both Annexin V and PI are either in the end stage of apoptosis, undergoing necrosis or already dead (upper right). (B) Phosphate‐buffered saline (PBS) group (×400). (C) Ad5‐GFP group. (D) Ad5‐TFPI‐2 group. (E) Positive control (a mixture of HL60 cells incubated with 0.5 μg/mL actinomycin D for 19 h to induce apoptosis, provided by Merck). A dark brown 3,3′‐diaminobenzidine tetrachloride (DAB) signal indicates positive staining while shades of blue to green signifies a non‐reactive cell. Counterstaining with methyl green aids in the morphological evaluation and characterization of normal and apoptotic cells.
Figure 5
Figure 5
The expressions of apoptosis‐related and cell‐cycle‐related proteins in GBCSD cells were examined by western blotting. (A) The expressions of cytochrome c, Bax, cleaved caspase‐3, ‐9 were increased after treatment with adenovirus‐mediated gene transfer of tissue factor pathway inhibitor‐2 (Ad5‐TFPI‐2), whereas the expression of Bcl‐2 was decreased. In addition, the expression of total p53 protein was not significantly changed for all three groups after treatment with Ad5‐TFPI‐2. The expressions of RB/pRB, p21 and p27 were also examined, and no significant alteration was observed. The optical density of target bands and control bands was quantified using Image Pro Plus 6.0 software (Media Cybernetics, Silver Spring, MD, USA). The density ratios of target bands to control bands were used to analyze the difference among each band. The numerical values were shown as gray histograms. (BK) Relative density of cleaved caspase‐9, cleaved caspase‐3, Bax, cytochrome c, Bcl‐2, p27, p21, RB, pRB, p53. Asterisk (*) indicates significant difference.

Similar articles

Cited by

References

    1. Misra S, Chaturvedi A, Misra NC, Sharma ID. Carcinoma of the gallbladder. Lancet Oncol 2003; 4: 167–76. - PubMed
    1. Eslick GD. Epidemiology of gallbladder cancer. Gastroenterol Clin North Am 2010; 39: 307–30, ix. - PubMed
    1. de Aretxabala X, Roa I, Berrios M et al Chemoradiotherapy in gallbladder cancer. J Surg Oncol 2006; 93: 699–704. - PubMed
    1. Gourgiotis S, Kocher HM, Solaini L, Yarollahi A, Tsiambas E, Salemis NS. Gallbladder cancer. Am J Surg 2008; 196: 252–64. - PubMed
    1. Saetta A, Lazaris AC, Michalopoulos NV, Davaris PS. Genetic alterations involved in the development of gallbladder carcinomas from Greek patients. Hepatogastroenterology 2001; 48: 1284–8. - PubMed

Publication types

Substances