Review
. 2012 Mar;27 Suppl 2(0 2):33-41.
doi: 10.1111/j.1440-1746.2011.07023.x.

Alcohol, insulin resistance and the liver-brain axis

Affiliations
Review

Alcohol, insulin resistance and the liver-brain axis

Suzanne de la Monte et al. J Gastroenterol Hepatol. 2012 Mar.

Abstract

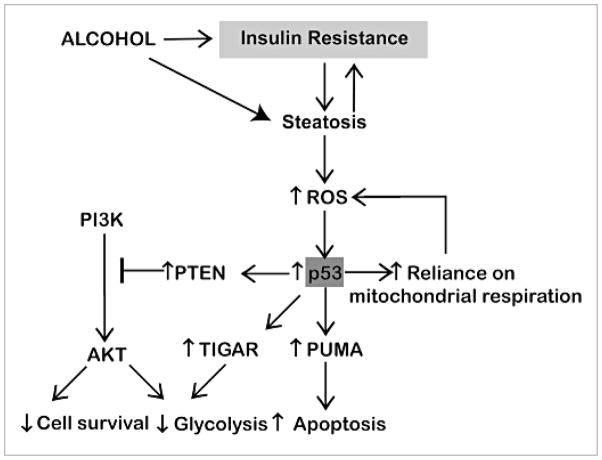
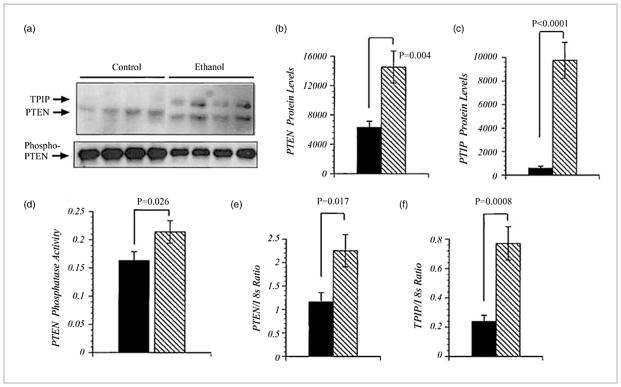
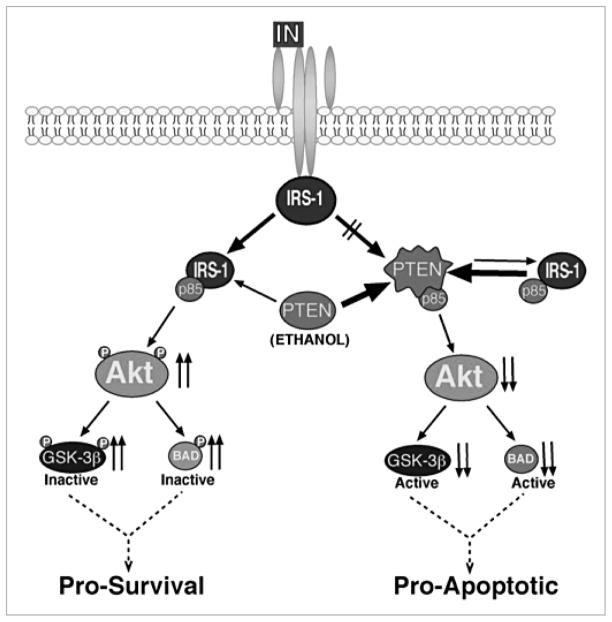
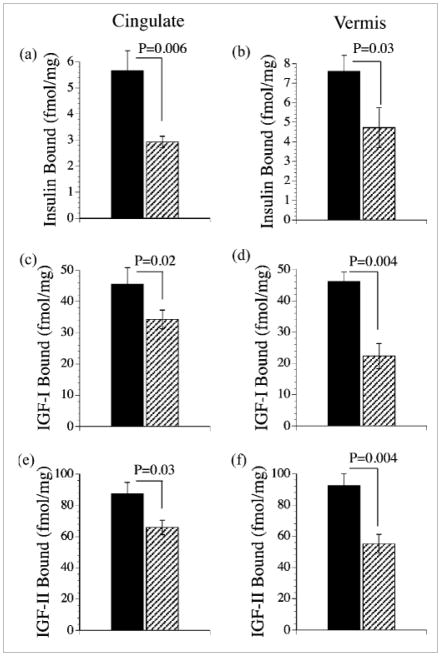
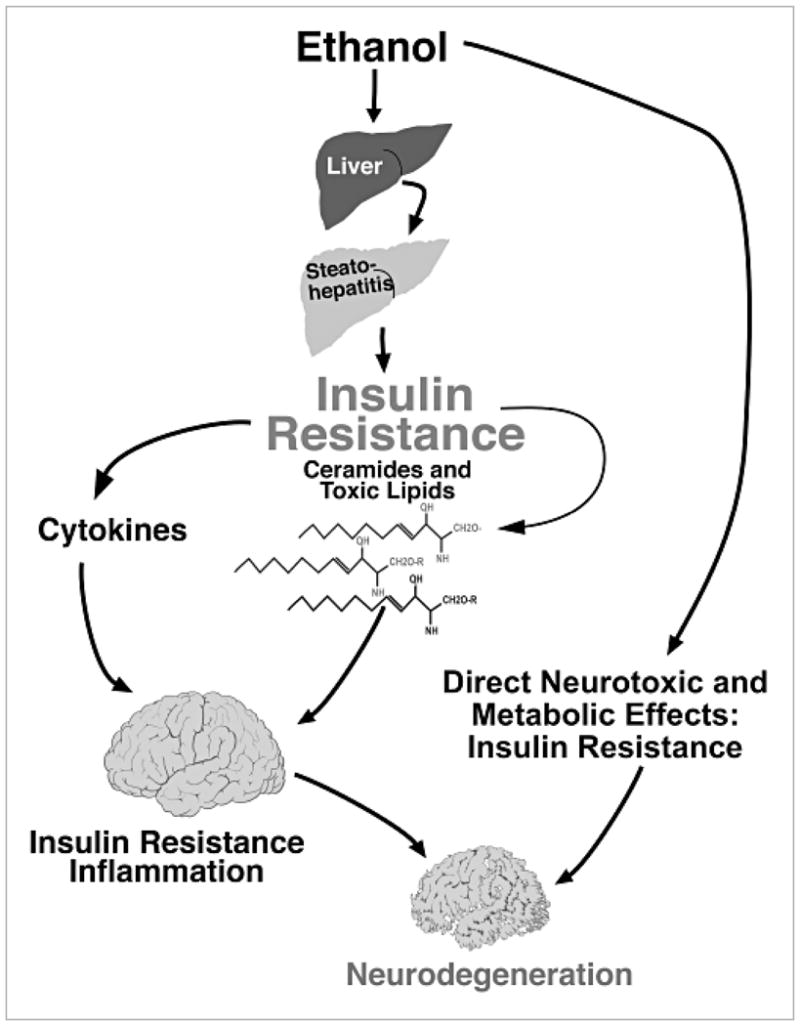
Chronic alcohol exposure inhibits insulin and insulin-like growth factor signaling in the liver and brain by impairing the signaling cascade at multiple levels. These alterations produced by alcohol cause severe hepatic and central nervous system insulin resistance as the cells fail to adequately transmit signals downstream through Erk/mitogen-activated protein kinase (MAPK), which is needed for DNA synthesis and liver regeneration, and phosphatidylinositol 3-kinase (PI3K), which promotes growth, survival, cell motility, glucose utilization, plasticity, and energy metabolism. The robust inhibition of insulin signaling in liver and brain is augmented by additional factors involving the activation of phosphatases such as phosphatase and tensin homologue (PTEN), which further impairs insulin signaling through PI3K/Akt. Thus, intact insulin signaling is important for neuronal survival. Chronic alcohol consumption produces steatohepatitis, which also promotes hepatic insulin resistance, oxidative stress and injury, with the attendant increased generation of "toxic lipids" such as ceramides that increase insulin resistance. The PI3K/Akt signaling cascade is altered by direct interaction with ceramides as well as through PTEN upregulation as a downstream target gene of enhanced p53 transcriptional activity. Cytotoxic ceramides transferred from the liver to the blood can enter the brain due to their lipid-soluble nature, and thereby exert neurodegenerative effects via a liver-brain axis. We postulate that the neurotoxic and neurodegenerative effects of liver-derived ceramides activate pro-inflammatory cytokines and increase lipid adducts and insulin resistance in the brain to impair cognitive and motor function. These observations are discussed in the context of insulin sensitizers as potential cytoprotective agents against liver and brain injury induced by alcohol.


Conflict of interest statement

Conflicts of interest: the authors have no conflict of interest.

Figures

Figure 1
Figure 1
Hepatocellular consequences of insulin resistance induced by chronic alcohol consumption, emphasizing the major concepts developed from our research. Central to the hypothesis of how alcohol contributes to liver injury and attenuates the repair process (regeneration) is the induction of insulin resistance. This cascade leads to a series of downstream adverse events involving cell survival, proliferation and apoptosis. Note the central role of p53 in this process. ROS, PUMA, P13K, PTEN.
Figure 2
Figure 2
Increased phosphatase and tensin homologue (PTEN) expression in liver tissue from alcohol-exposed rats. (a) Western blot autoradiograph demonstrating the expression of the PTEN and TPIP proteins in liver homogenates. (b and c) Mean levels (± SEM) of PTEN or TPIP measured by digital image analysis of Western blot signals. (d) Levels of PTEN phosphatase activity measured in immunoprecipitates using the Biomol Green assay. (e and f) A real-time quantitative polymerase chain reaction was used to examine the mRNA levels of PTEN, TPIP, and 18 s. The actual levels of expression were determined from standard curves generated with recombinant plasmid DNA. PTEN and TPIP mRNA levels were normalized to 18 s to control for slight differences in template loading or cellular RNA abundance. Means ± SEM of the calculated PTEN/18 s and TPIP/18 s copy number ratios for each group.
Figure 3
Figure 3
Hypothetical model of acute alcohol effects on insulin signaling through phosphatidylinositol 3-kinase (PI3K)/Akt and the role of phosphatase and tensin homologue (PTEN). In the absence of alcohol exposure, as shown on the left, the insulin signal is transmitted through insulin receptor substrate-1 (IRS-1) followed by binding of the p85α subunit of PI3K. This event activates the kinase and leads to Akt phosphorylation. The phosphorylation of Akt results in the phosphorylation of GSK3β and BAD, rendering them inactive. The functional effects are increased pro-survival signals. In the presence of acute alcohol exposure there is preferential binding of the p85α subunit of PI3K to PTEN, which competes for its binding to IRS-1. The net effect is the reduced phosphorylation of Akt as well as GSK3β and BAD, rendering the latter two signaling molecules active. Under these conditions there is a generation of pro-apoptotic signals and hepatocytes are more susceptible to injury due to the acute effects of alcohol.
Figure 4
Figure 4
Peroxisome proliferator-activated receptor (PPAR)δ agonist improves ethanol-impaired liver regeneration. Adult male Long–Evans rats were fed with liquid diets containing 0% or 37% ethanol, treated with a PPARδ agonist, and then subjected to a two-thirds hepatectomy. Subsequently, 24 h later, the remnant regenerating livers were used to measure (a,c) proliferating cell nuclear antigen (PCNA) (a, d) aspartyl-(asparaginyl)-β-hydroxylase (AAH) (a,e) glyceraldehyde-3-phosphate dehydrogenase (GAPDH) and the (a) p85 subunit of PI3 kinase (negative control) expression by (a) Western blot analysis and (c–e) digital image quantification (arbitrary densitometry units). Two h before they were killed, the rats were injected with bromodeoxyuridine (BrdU). The histological sections were immunostained to detect nuclear BrdU. Under code, BrdU positive and negative hepatocytes were enumerated in 10 adjacent 100 × magnification fields per slide. (b) The percentages of BrdU-labeled nuclei in regenerating livers from control, ethanol exposed and ethanol exposed + PPARδ agonist treated rats. For all studies, inter-group comparisons were made using one-way repeated measures ANOVA and the Tukey–Kramer post-hoc test of significance. P-values are indicated in each panel. Note that PPARδ agonist treatments significantly increased DNA synthesis, and PCNA, AAH, and GAPDH expression during liver regeneration. ( formula image
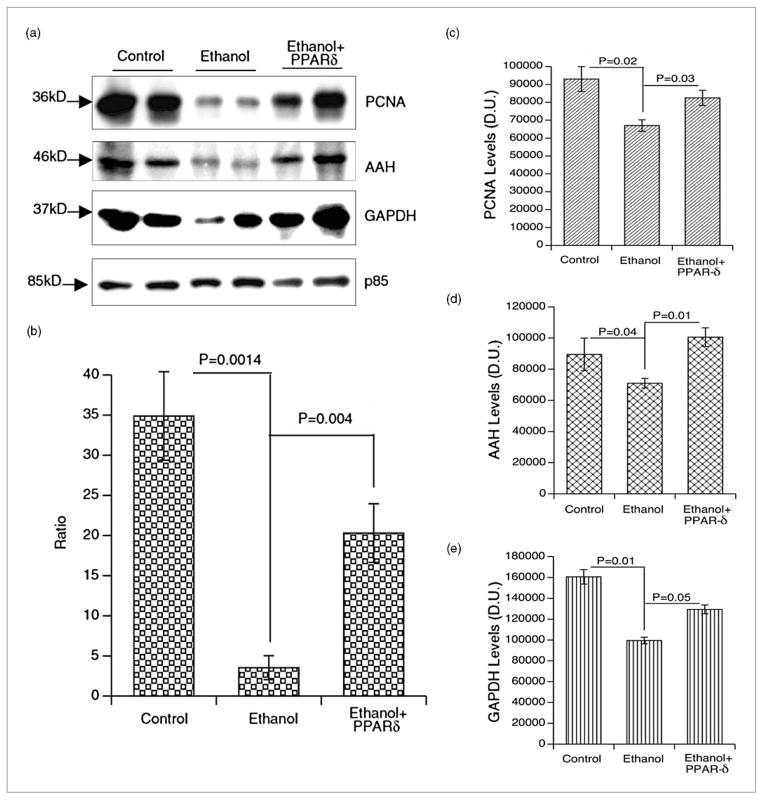
) BrdU(+)/total hepatocytes; (▨) PCNA; (▩) AAH; (▥) GAPDH.
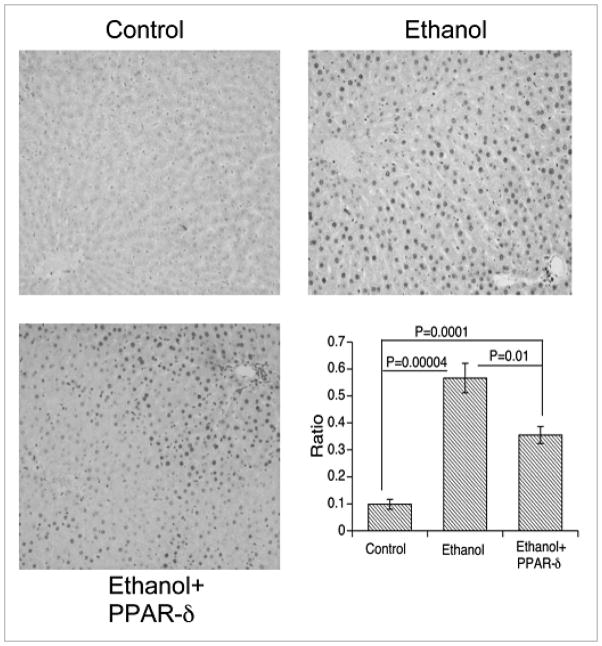
Figure 5
Figure 5
Peroxisome proliferator-activated receptor (PPAR)δ agonist treatment partially reversed ethanol-induced oxidative stress. Regenerating Long–Evans rat livers were used to measure oxidative stress (original magnifications 100 ×). The ratios of 8-OHdG-positive nuclei to total nuclei in 10–100 × microscopic fields were determined The graph (lower right panel) shows the mean relative densities of 8-Oxo-2′-deoxyguanosine (8-OHdG) immunoreactive nuclei in regenerating livers from control, ethanol exposed, and ethanol exposed + PPARδ agonist treated rats. Inter-group comparisons were made using one-way repeated measures ANOVA and the Tukey–Kramer post hoc significance test. P -values are indicated within each panel. (▧) (8-OHdG)/total hepatocytes.
Figure 6
Figure 6
Chronic alcohol abuse impairs insulin receptor binding in the human brain. Equilibrium binding assays were performed by incubating membrane protein extracts of (a, c, e) anterior cingulate gyrus or (b, d, f) cerebellar vermis overnight at 4°C with 50 pmol [125I]-labeled insulin, insulin-like growth factor (IGF-I), or IGF-II as tracer, in the presence or absence of 100 mmol cold ligand. The membrane bound tracer was precipitated by adding bovine gamma globulin and polyethylene glycol-8000 to the reactions and centrifuging the samples (14 000 g ). The radioactivity present in the supernatant fractions (containing unbound/free ligand) and the pellets (containing bound ligand) was measured in a gamma counter. Specific binding (fmol/mg) was calculated using the GraphPad Prism version 4.00 for Windows, GraphPad Software, San Diego, CA, USA, http://www.graphpad.com. Graphs depict mean ± SEM of results obtained for (a, b) insulin (c, d) IGF-1, and (e, f) IGF-2 specific binding with six cases per group. Data were analyzed statistically using Student’s t-tests. Significant P-values are indicated over the bar graphs. (■) control; (▨) alcoholic rats.
Figure 7
Figure 7
Liver–brain axis of neurodegeneration hypothesis. Progressive hepatic steatosis incites inflammation and pro-inflammatory cytokine activation. Attendant insulin resistance initiates a lipolysis and lipid disequilibrium cascade, leading to the increased production and accumulation of ceramides. The ceramides are cytotoxic and promote insulin resistance, and their lipid solubility enables ready transfer across the blood–brain barrier to cause central nervous system insulin resistance and neurodegeneration with loss of neurons and oligodendrocytes. Ethanol’s lipid solubility enables it to exert direct neurotoxic effects and cause brain insulin resistance.

References

    1. Ullrich A, Bell JR, Chen EY, et al. Human insulin receptor and its relationship to the tyrosine kinase family of oncogenes. Nature. 1985;313:756–61. - PubMed
    1. Bonini JA, Colca JR, Dailey C, White M, Hofmann C. Compensatory alterations for insulin signal transduction and glucose transport in insulin-resistant diabetes. Am J Physiol. 1995;269 (4 Pt 1):E759–65. - PubMed
    1. Skolnik EY, Batzer A, Li N, et al. The function of GRB2 in linking the insulin receptor to Ras signaling pathways. Science. 1993;260:1953–5. - PubMed
    1. Ito T, Sasaki Y, Wands JR. Overexpression of human insulin receptor substrate 1 induces cellular transformation with activation of mitogen-activated protein kinases. Mol Cell Biol. 1996;16:943–51. - PMC - PubMed
    1. Tanaka S, Ito T, Wands JR. Neoplastic transformation induced by insulin receptor substrate-1 overexpression requires an interaction with both Grb2 and Syp signaling molecules. J Biol Chem. 1996;271:14610–16. - PubMed

Publication types

MeSH terms