Review
. 2012 May;45(2):147-207.
doi: 10.1017/S0033583512000017. Epub 2012 Feb 10.

Biophysics of mitosis

Affiliations
Review

Biophysics of mitosis

J Richard McIntosh et al. Q Rev Biophys. 2012 May.

Abstract

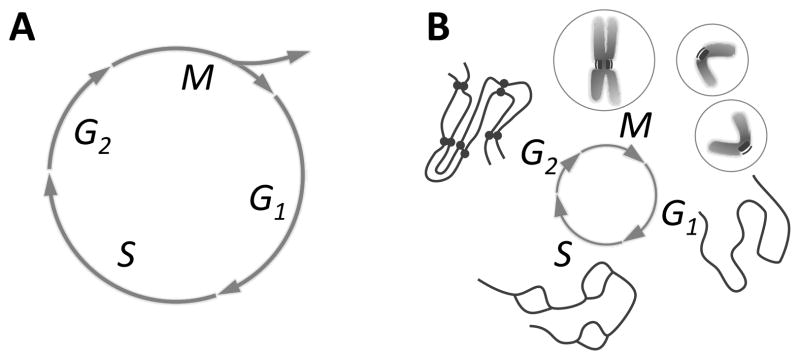
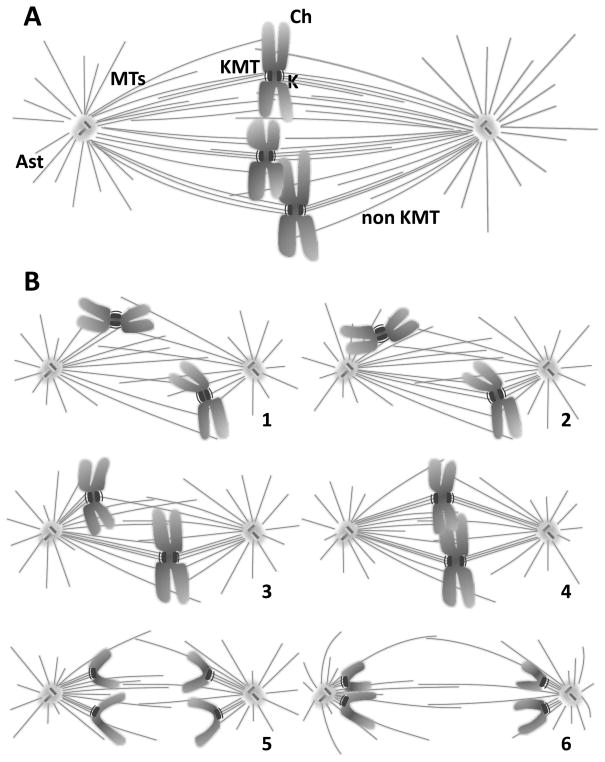
Mitosis is the process by which eukaryotic cells organize and segregate their chromosomes in preparation for cell division. It is accomplished by a cellular machine composed largely of microtubules (MTs) and their associated proteins. This article reviews literature on mitosis from a biophysical point of view, drawing attention to the assembly and motility processes required to do this complex job with precision. Work from both the recent and the older literature is integrated into a description of relevant biological events and the experiments that probe their mechanisms. Theoretical work on specific subprocesses is also reviewed. Our goal is to provide a document that will expose biophysicists to the fascination of this quite amazing process and provide them with a good background from which they can pursue their own research interests in the subject.


Figures

Figure 1
Figure 1. The cell growth and division cycle
Fig. 1A: Mitosis (M) is seen in the context of the whole cell cycle, represented as a circle. “Interphase”, the time between divisions, includes S phase, when the cell’s DNA is replicated, and gaps (G1 and G2) before and after S phase. M is followed by cell division, or “cytokinesis”, which divides the already duplicated cell into two essentially identical pieces. The timing of cytokinesis relative to mitosis and interphase varies among different cells, so it is shown only as the forking arrows that imply the emergence of two cells from one. Fig. 1B: Chromosome structure as a function of time in the cell cycle: in G1 one de-condensed chromosome is shown, representing all chromosomes in the cell. These are replicated during S (“bubbles” are places where replication has already occurred, but replication is not yet complete). In G2 there are two copies of each chromosome, still held together by cohesions (bars between “chromatids” in the diagram). In early M (prophase) the chromosomes condense, whereupon one can see each chromosome as a double object with two chromatids and a primary constriction (centromere) where cohesions still hold the chromatids together. This is the site where kinetochores form. During M the chromatids separate; in cytokinesis a cell is formed around each chromosome set. Circles on either side of M represent first the one, then the two cells formed by division.
Figure 2
Figure 2. Formation of a typical mitotic spindle
Fig. 2A: A typical spindle at metaphase, showing three chromosomes (Ch) situated near the spindle equator. The spindle poles (SP) and the microtubules (MTs) form the body of the spindle. All MTs are polar polymers, vectorial nature not diagrammed, which are oriented with their plus ends distal to the pole with which they are associated. MTs that associate with kinetochores (Ks), called KMTs, share this polar orientation. Some KMTs reach all the way to the pole but some do not. Many MTs do not end on Ks (nonKMTs), either because they miss that target or because they pass right through the chromatin. Some MTs project away from the spindle and form the asters (Ast). Fig. 2B: Diagrams showing spindle formation (1–4), including chromosome-spindle attachment (1–3) and chromosome congression to the metaphase plate (3,4). Chromosome segregation in anaphase A (5) is followed by spindle elongation, or anaphase B (6). Cytokinesis ensues (not shown).
Figure 3
Figure 3. Spindle structure as seen in the electron microscope
Fig. 3A: High voltage electron micrograph of a mitotic mammalian cell, strain PtK1, in metaphase. Chromosomes are stained with uranyl acetate, MTs by colloidal gold attached to an antibody specific for tubulin. Bundles of MTs converge on each kinetochore; at their other ends they focus at the poles. Astral MTs are clear. Background fibers are mostly intermediate filaments that are not part of the spindle. Bar = 1μm. (Micrograph courtesy of Mary Morphew, Univ. Colorado, reprinted from McIntosh, Mol. Biol. Cell, Nov., 2011). Fig. 3B: Electron micrographs of spindles from the yeast, Saccharomyces cerevisiae. Left shows the spindle pole bodies (SPB) of a metaphase cell as part of the nuclear envelope (NE); the MTs course through the nucleoplasm, but the chromosomes are not sufficiently condensed to be visible. Bar = 0.5μm. Right shows two slices from a tomographic reconstruction of one spindle pole and MTs emanating from it. Their pole-proximal “minus” ends are capped and connected to the pole by slender strands (arrowheads). MT plus ends flare out as the protofilaments bend near the MT end. Bar = 75 nm. (Micrographs courtesy of Eileen O’Toole, Univ. Colorado.)
Figure 4
Figure 4. Mechanisms of centrosome separation
Fig. 4A: Spindle pole separation driven by motors that cross-bridge antiparallel MTs. The dominant effect is from plus end-directed motors, which walk in that direction on the pairs of antiparallel MTs to which they are connected. This action pulls the MT ends nearer to one another (Fig. 2A: 2,3). Increased pole separation is permitted by MT elongation. Fig 4B: Diagram showing zoomed in views of the 1st and 3rd states of spindle elongation from Fig. 4A. MT sliding is actually driven by a balance of forces generated by both plus and minus end directed motors. The spindle reaches its steady state length when the number of motors pulling in each direction becomes equal. Fig. 4C: Spindle pole separation driven by pulls from outside the spindle acting on centrosome-associated astral MTs. Dark dots represent sites of cortex-attached minus end-directed motor activity that pulls on the MTs and thus on the spindle poles, forcing them apart. On panel 2 black arrows show forces generated by motors that act on a left pole and grey arrows for forces that act on the right pole.
Figure 5
Figure 5. Formation of acentrosomal spindles
Fig. 5A: Spindle formation without centrosomes in extracts from amphibian oocytes. MTs form near chromosomes, due to protein activities regulated by RanGTP. MT-dependent motor activities then rearrange these polymers, clustering their minus ends, so a bipolar spindle is formed. The insert shows how minus-end directed motors that crosslink MTs can align and focuses them into pole-like structure. Fig. 5B: Spindle formation without centrosomes in higher plant cells. There are regions near the nucleus where MT initiation is probable, as with centrosomes, even though no such structures are seen. In this diagram, only one such pole is shown, but in reality, MTs grow into the nuclear region from both sides. As the nuclear envelope disperses, these MTs grow into the nucleoplasm, forming a bipolar MT array in which some polymers interact directly with kinetochores.
Figure 6
Figure 6. Forming correct chromosome spindle interactions
Fig. 6A: Diagram of chromosomes that are incorrectly connected to the spindle by three different arrangements: 1) monotele, 2) syntele, and 3) merotele. Fig. 6B: Model for a mechanism by which tension at the centromere might reduce the access of Aurora B kinase to substrates important for kinetochore-MT attachment (after Tanaka et al., 2002). Chromosome strain in response to tension moves MT attachment sites out of the region affected by Aurora kinase activity (stippling). Each kinetochore is shown as a layered structure: the dark arc represents the outer kinetochore and shaded bar represents the inner. Fig 6C: Situations where inter- and intra- kinetochore tension can be independently controlled in vivo indicated how the SAC might sense tension within a single kinetochore and not across sister kinetochores. Kinetochore are shown as in 6B.
Figure 7
Figure 7. The morphology of anaphase
Electron micrograph of a mammalian cell in anaphase, showing spindle MTs during chromosome separation. This cell has also already started anaphase B. A 250 nm thick slice from a plastic-embedded PtK1 cell that was lysed in the presence of an equilibrium mixture of tubulin and MTs, then fixed with aldehydes and OsO4, followed by staining with uranyl acetate and lead citrate and imaging in a high voltage electron microscope. Courtesy of Mary Morphew, Univ. of Colorado.

References

    1. AIST JR, BAYLES CJ, TAO W, BERNS MW. Direct experimental evidence for the existence, structural basis and function of astral forces during anaphase B in vivo. J Cell Sci. 1991;100 (Pt 2):279–288. - PubMed
    1. AKIYOSHI B, SARANGAPANI KK, POWERS AF, NELSON CR, REICHOW SL, ARELLANO-SANTOYO H, GONEN T, RANISH JA, ASBURY CL, BIGGINS S. Tension directly stabilizes reconstituted kinetochore-microtubule attachments. Nature. 2010;468(7323):576–579. - PMC - PubMed
    1. ALEXANDER SP, RIEDER CL. Chromosome motion during attachment to the vertebrate spindle: initial saltatory-like behavior of chromosomes and quantitative analysis of force production by nascent kinetochore fibers. J Cell Biol. 1991;113(4):805–815. - PMC - PubMed
    1. ALTAN-BONNET N, SOUGRAT R, LIPPINCOTT-SCHWARTZ J. Molecular basis for Golgi maintenance and biogenesis. Curr Opin Cell Biol. 2004;16(4):364–372. - PubMed
    1. ANTONIO C, FERBY I, WILHELM H, JONES M, KARSENTI E, NEBREDA AR, VERNOS I. Xkid, a chromokinesin required for chromosome alignment on the metaphase plate. Cell. 2000;102(4):425–435. - PubMed

Publication types