. 2012 Mar 16:1229:129-39.
doi: 10.1016/j.chroma.2011.12.099. Epub 2012 Jan 11.

Development of a carbon clad core-shell silica for high speed two-dimensional liquid chromatography

Affiliations

Development of a carbon clad core-shell silica for high speed two-dimensional liquid chromatography

Changyub Paek et al. J Chromatogr A. .

Abstract

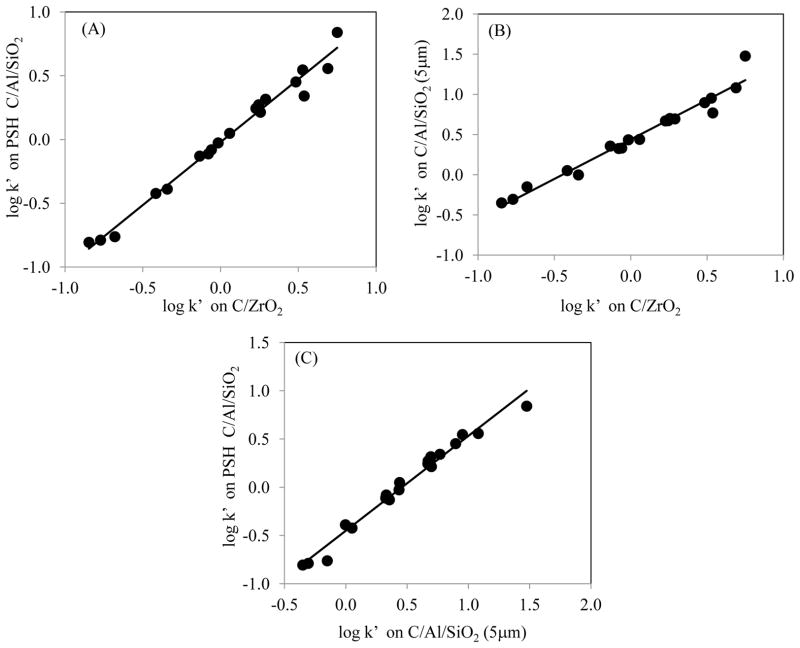
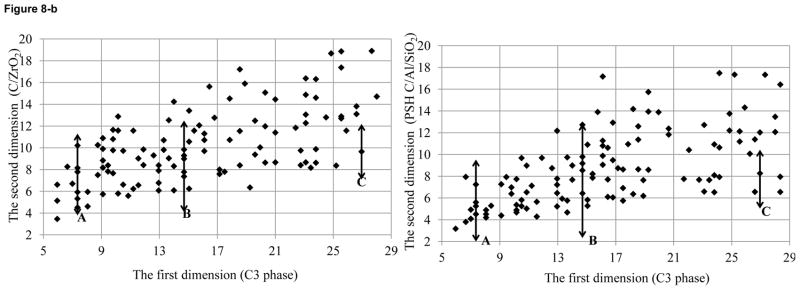
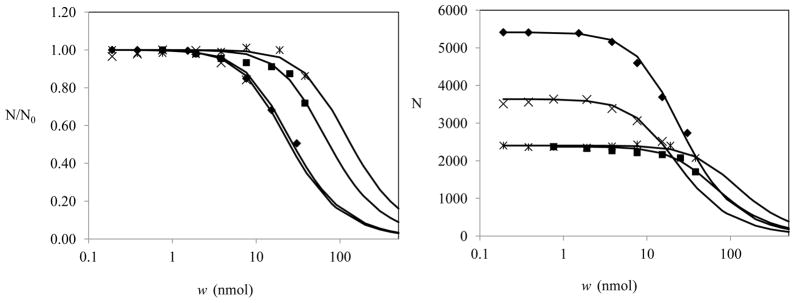
We recently introduced a new method to deposit carbon on fully porous silicas (5 μm) to address some of the shortcomings of carbon clad zirconia (C/ZrO(2)), which has rather low retention due to its low surface area (20-30 m(2)/g). The method enables the introduction of a thin, homogeneous layer of Al(III) on silica to serve as catalytic sites for carbon deposition without damaging the silica's native pore structure. Subsequent carbon deposition by chemical vapor deposition resulted in chromatographically useful carbon phases as shown by good efficiencies and higher retentivity relative to C/ZrO(2). Herein, we use the above method to develop a novel carbon phase on superficially porous silica (2.7 μm). This small, new form of silica offers better mass transfer properties and higher efficiency with lower column back pressures as compared to sub 2 μm silica packings, which should make it attractive for use as the second dimension in fast two-dimensional LC (LC × LC). After carbon deposition, several studies were conducted to compare the new packing with C/ZrO(2). Consistent with work on 5 μm fully porous silica, the metal cladding did not cause pore blockage. Subsequent carbon deposition maintained the good mass transfer properties as shown by the effect of velocity on HETP. The new packing exhibits efficiencies up to ∼5.6-fold higher than C/ZrO(2) for polar compounds. We observed similar chromatographic selectivity for all carbon phases tested. Consequently, the use of the new packing as the second dimension in fast LC×LC improved the peak capacity of fast LC × LC. The new material gave loading capacities similar to C/ZrO(2), which is rather as expected based on the surface areas of the two phases.


Figures

Figure 1
Figure 1
Differential pore size distributions for pore volume and surface area computed by the BJH method from nitrogen adsorption (upper) and desorption (lower) data. (*) SiO2; (△) one monolayer (8 μmol/m2) Al (III) treated SiO2; (◇) carbon coated on Al/SiO2.
Figure 2
Figure 2
Plot of log k′ vs. number of methylene groups for (a) nitroalkanes (see Fig. 1); (b) alkylbenzene homologs (benzene, toluene, ethylbenzene, propylbenzene and butylbenzene); LC conditions: F = 0.4 ml/min., T = 40 °C, 35/65 MeCN/water for (a), 50/50 MeCN/water for (b); (◆) PSH C/Al/SiO2; (X) C/ZrO2 (33 mm x 2.1 mm id. columns)
Figure 3
Figure 3
Selectivity comparison of different carbon phases via κ–κ plots. LC condition: F = 0.4 mL/min., T = 40 °C, 210 nm, 50/50 MeCN/water, 33 mm x 2.1 mm id. columns; Data for C/Al/SiO2 (see Table 2 for description of this material) were obtained from [30]. (A) R2 = 0.983, S.E. = 0.07, slope = 0.99±0.03; (B) R2 = 0.962, S.E. = 0.1, slope = 0.98±0.05; (C) R2 = 0.979, S.E.= 0.07, slope = 0.98±0.04. Solutes are N-benzylformamide, benzylalcohol, phenol, 3-phenylpropanol, benzene, anisole, benzonitrile, toluene, acetophenone, ethylbenzene, p-xylene, bromobenzene, methylbenzoate, propylbenzene, p-chlorotoluene, butylbenzene, nitrobenzene, p-dichlororbenzene, and benzophenone in order of increase in retention on C/ZrO2.
Figure 4
Figure 4
Figure. 4-a. Plots for N/Nbenzene on each phase vs. various solutes. See Fig. 4 for the experimental conditions. (X) C/ZrO2; (◆) PSH C/Al/SiO2; (■) C/Al/SiO2 Figure. 4-b. NPSH C/Al/SiO2/NC/ZrO2 (black bars) k′PSH C/Al/SiO2/k′C/ZrO2 (white bars) vs. various solutes.
Figure 4
Figure 4
Figure. 4-a. Plots for N/Nbenzene on each phase vs. various solutes. See Fig. 4 for the experimental conditions. (X) C/ZrO2; (◆) PSH C/Al/SiO2; (■) C/Al/SiO2 Figure. 4-b. NPSH C/Al/SiO2/NC/ZrO2 (black bars) k′PSH C/Al/SiO2/k′C/ZrO2 (white bars) vs. various solutes.
Figure 5
Figure 5
Comparison of flow curves for different columns. (◆) PSH C/Al/SiO2; (X) C/ZrO2; The solid lines correspond to the best-fitted curves calculated by Eq. (2); LC conditions: T = 40 °C, 210 nm, 31/69 MeCN/water, both are 33 mm x 2.1 mm id. columns; The dashed line is for PSH C18 (100 mm x 4.6 mm id. column) calculated based on the parameters reported in [10].
Figure 6
Figure 6
Comparison for separation of the mixture of four indole metabolites. (a) C/ZrO2; (b) PSH C/Al/SiO2. LC conditions: A, 10mM phosphoric acid in water; B, MeCN; 0–36 % B for (a); 5–41 % B for (b) in 0–3.5 min; F = 1 ml/min, T = 80 °C, 220 nm, 33 mm x 2.1 mm id. columns for both. Solutes: 1, Indole-5-hydroxy-typtamine; 2, Indole-3-acetyl-ε-L-lysine; 3, Indole-3-ethanol; 4, Indole-3-butyric acid.
Figure 7
Figure 7
Chromatograms of mixture of four indolic metabolites on (a) C/ZrO2, (b) PSH C/Al/SiO2 and (c) C/Al/SiO2 (5 mm). LC conditions: A, 20 mM perchloric acid in water; B, MeCN; 5–33 % B (a); 8–36 % B for (b); 18–50 % B in for (c) 0–3.5 min; F = 1 ml/min, T = 80 °C, 220 nm, 25 μl injection, 33 mm x 2.1 mm id. column for all. The analyte diluents (B/A) are 20/80 (solid line), 40/60 (doutble dotted line), 80/20 (dashed line)
Figure 8
Figure 8
Figure 8-a. Comparison of LC x LC chromatograms on C/ZrO2 and PSH C/Al/SiO2; First Dimension: Solvent A is 20 mM phosphate pH 5.7. Solvent B is acetonitrile; 0–50 % B in 24 min.100 mm x 2.1 mm id. C3 column; Second Dimension: Solvent A is 10 mM phosphoric acid for (a) and (b), 100 mM perchloric acid for (c) and (d). Solvent B: acetonitrile. 33 mm x 2. 1 mm id. 0–100 % B in 18 sec. and 3 sec. for re-equilibration. Peak capacities of the second dimension for (a), (b), (c) and (d) are 34, 39, 35 and 43. Figure 8-b Comparison of LC x LC plots for the distribution of observed peaks using C/ZrO2 with the phosphate buffer (left) or (b) PSH C/Al/SiO2 with the perchlorate buffer (right) as the second dimension column. The arrows for A, B and C correspond to the time frame for the single second dimension chromatogram shown in Fig. 9–c. Figure 8-c Slices of the single second dimension chromatogram for C/ZrO2 (dashed line) and the PSH C/Al/SiO2 (solid line) at the beginning (A), middle (B) and end (C) of the first dimension gradient elution as designated in Fig. 9–b.
Figure 8
Figure 8
Figure 8-a. Comparison of LC x LC chromatograms on C/ZrO2 and PSH C/Al/SiO2; First Dimension: Solvent A is 20 mM phosphate pH 5.7. Solvent B is acetonitrile; 0–50 % B in 24 min.100 mm x 2.1 mm id. C3 column; Second Dimension: Solvent A is 10 mM phosphoric acid for (a) and (b), 100 mM perchloric acid for (c) and (d). Solvent B: acetonitrile. 33 mm x 2. 1 mm id. 0–100 % B in 18 sec. and 3 sec. for re-equilibration. Peak capacities of the second dimension for (a), (b), (c) and (d) are 34, 39, 35 and 43. Figure 8-b Comparison of LC x LC plots for the distribution of observed peaks using C/ZrO2 with the phosphate buffer (left) or (b) PSH C/Al/SiO2 with the perchlorate buffer (right) as the second dimension column. The arrows for A, B and C correspond to the time frame for the single second dimension chromatogram shown in Fig. 9–c. Figure 8-c Slices of the single second dimension chromatogram for C/ZrO2 (dashed line) and the PSH C/Al/SiO2 (solid line) at the beginning (A), middle (B) and end (C) of the first dimension gradient elution as designated in Fig. 9–b.
Figure 9
Figure 9
The effect of sample load on the normalized plate count (left) and on the actual plate count (right). (*) ODS, (■) 5 μm C/Al/SiO2; (◆) PSH C/Al/SiO2; (X) C/ZrO2; The solid lines correspond to the best-fitted curves calculated by Eq. (1); ω0.5 = 135, 74, 28 and 25 for ODS, C/Al/SiO2, PSH C/Al/SiO2 and C/ZrO2, respectively; LC conditions: F = 0.4 mL/min., T = 40 oC, 210 nm, 43/57, 35/65, 31/69 MeCN/water for ODS, 25 % C/Al/SiO2, C/ZrO2, respectively, all are packed in 33 mm x 2.1 mm id. columns.

References

    1. Paek C, McCormick AV, Carr PW. J Chromatogr, A. 2011;1218:1359. - PMC - PubMed
    1. Guillarme D, Ruta J, Rudaz S, Veuthey J-L. Anal Bioanal Chem. 2010;397:1069. - PubMed
    1. Tanaka N, Kobayashi H, Ishizuka N, Minakuchi H, Nakanishi K, Hosoya K, Ikegami T. J Chromatogr, A. 2002;965:35. - PubMed
    1. Thompson JD, Carr PW. Anal Chem. 2002;74:4150. - PubMed
    1. Mazzeo JR, Neue UD, Kele M, Plumb RS. Anal Chem. 2005;77:460A.

Publication types

LinkOut - more resources