. 2012 Nov 1;131(9):2034-43.
doi: 10.1002/ijc.27480. Epub 2012 Mar 27.

Acid ceramidase-mediated production of sphingosine 1-phosphate promotes prostate cancer invasion through upregulation of cathepsin B

Affiliations

Acid ceramidase-mediated production of sphingosine 1-phosphate promotes prostate cancer invasion through upregulation of cathepsin B

Thomas H Beckham et al. Int J Cancer. .

Abstract

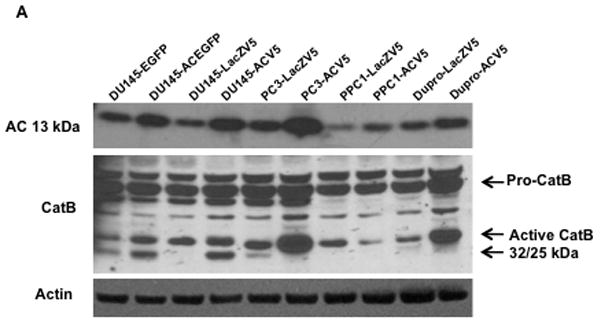
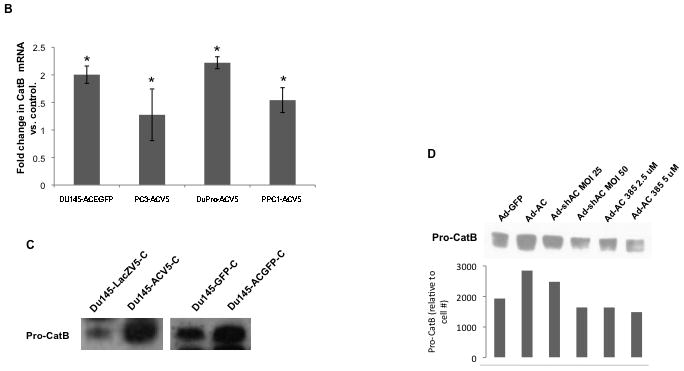
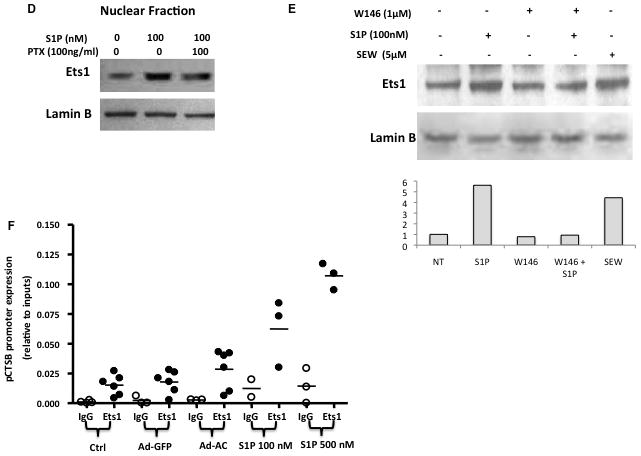
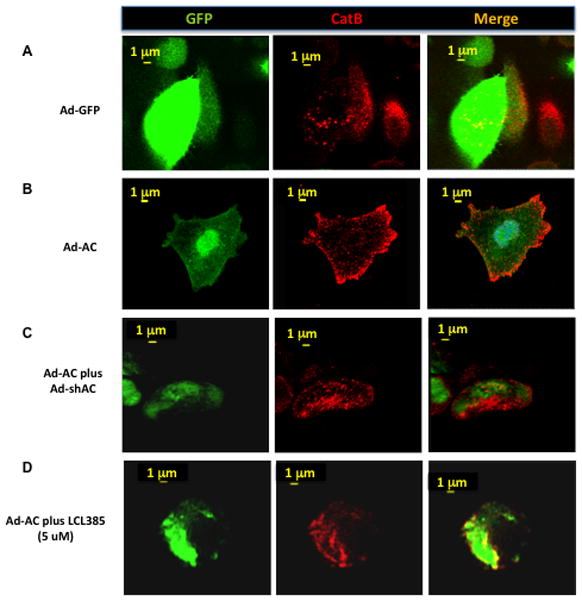
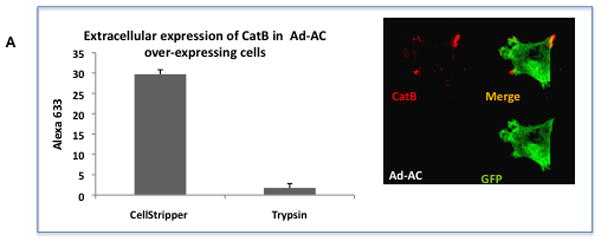
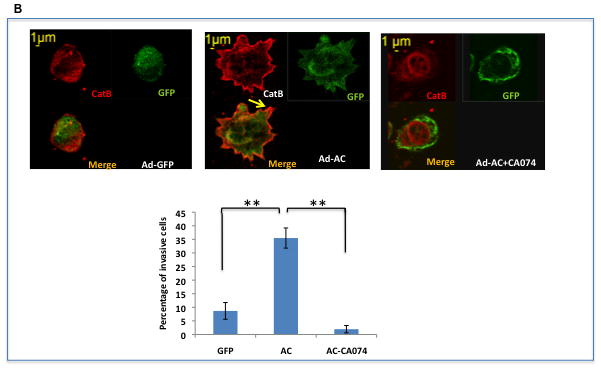
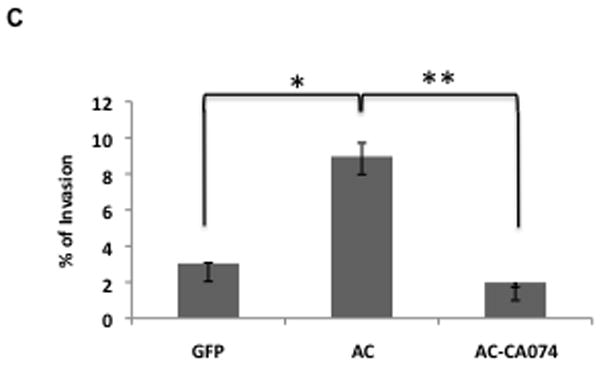
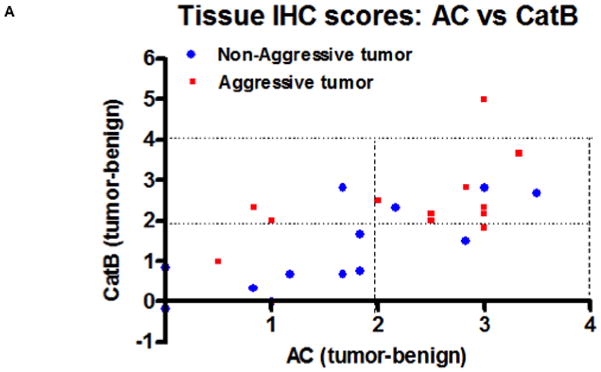
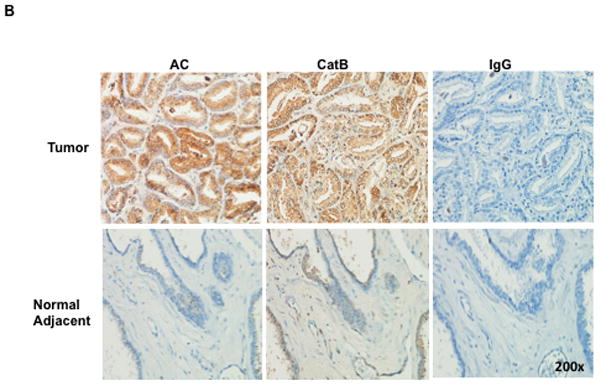
Invasiveness is one of the key features of aggressive prostate cancer; however, our understanding of the precise mechanisms effecting invasion remains limited. The ceramide hydrolyzing enzyme acid ceramidase (AC), overexpressed in most prostate tumors, causes an aggressive and invasive phenotype through downstream effectors that have not yet been well characterized. Here, we demonstrate that AC, through generation of sphingosine-1-phosphate (S1P), promotes Ets1 nuclear expression and binding to the promoter region of matrix-degrading protease cathepsin B. Through confocal microscopy and flow cytometry, we found that AC overexpression promotes pericellular localization of cathepsin B and its translocation to the outer leaflet of the cell membrane. AC overexpressing cells have an increased abundance of cathepsin B-enriched invasive structures and enhanced ability to invade through a collagen matrix, but not in the presence of an inhibitor of cathepsin B. In human prostate tissues, AC and cathepsin B overexpression were strongly associated and may relate to poor outcome. These results demonstrate a novel pathway by which AC, through S1P, promotes an invasive phenotype in prostate cancer by causing overexpression and secretion of cathepsin B through activation and nuclear expression of Ets1. As prostate cancer prognosis is dramatically worse when invasion has occurred, this study provides critical insight into the progression toward lethal prostate cancer.


Figures

Figure 1
Figure 1. Acid ceramidase causes transcriptional upregulation of cathepsin B through Ets1 activation
DU145, PC3, PPC1, and Dupro prostate cancer cell lines were generated using a plasmid coding for AC or empty vector. Western blot analysis (A) and RT-PCR (B) were performed on these cell lines. mRNA expression is normalized to empty vector expression. Conditioned media from DU145 AC-overexpressing cell lines were concentrated and protein expression was compared to control cells (C). Conditioned media of cells infected with Ad-GFP (MOI 50), Ad-AC (MOI 50), Ad-shAC, or Ad-AC (MOI 50) with the AC inhibitor LCL385 were collected and analyzed by western blotting (D) ImageJ densitometry values were normalized by treatment-specific cell number to obtain the column graph depicting relative cathepsin B as detected on the immunoblot. Nuclei of DU145 and PPC1 cells infected with Ad-GFP or Ad-AC were isolated and subjected to Western blotting for Ets1 expression (E). Chromatin immunoprecipitation of uninfected, Ad-GFP, or Ad-AC infected PPC1 cells demonstrates Ets1 binding to the cathepsin B promoter (F). *p<.05 student’s t-test.
Figure 2
Figure 2. S1P drives AC-induced cathepsin B transcription and expression
Ad-AC infected cells were collected and S1P concentration was analyzed by LC-MS (A). Naïve PPC1 cells were stimulated with exogenous S1P at the indicated concentrations and the conditioned media were analyzed by Western blotting (B). Cathepsin B secretion was analyzed in the conditioned medium of Ad-GFP or Ad-AC infected cells treated with the indicated concentrations of the sphingosine kinase inhibitor SKI two hours prior to infection (C). The nuclear fractions of PPC1 cells stimulated with either S1P or S1P plus pertussis toxin were collected and analyzed by Western blotting (D). The nuclear fractions of PPC1 cells stimulated with S1P, W146, S1P plus W146, or SEW 2871 were collected and analyzed by Western blotting. ImageJ was used to determine Ets1 band intensity normalized to Lamin B, and these values were normalized to the untreated lane (E). Chromatin immunoprecipitation of control, Ad-GFP, Ad-AC infected PPC1 cells, or S1P stimulated PPC1 cells was utilized to determine Ets1 binding to the cathepsin B promoter under these conditions (F).
Figure 3
Figure 3. Active cathepsin B localizes to the cell membrane in AC overexpressing cells
We performed confocal microscopy on PPC1 cells infected for 24 hours with Ad-GFP (A) or Ad-AC(B) at MOI 50. Green fluorescence represents the GFP tag of the adenoviruses and indicates successful infection. Red fluorescence represents immunostaining for cathepsin B(A–D) or cathespin B activity (E and F). In C, PPC1 cells were co-infected with Ad-AC and Ad-shAC. PPC1 cells were infected with Ad-AC and simultaneously treated with the AC inhibitor LCL385 (D). PPC1 cells were infected with Ad-GFP (E) or Ad-AC (F) and treated with a fluorogenic cathepsin B substrate.
Figure 4
Figure 4. AC overexpression promotes cathepsin B outer membrane association
A: Ad-AC infected PPC1 cells were collected with non-proteolytic Cell Stripper or Trypsin and analyzed by FACS for cell surface expression of cathepsin B. The confocal image shows a non-permeabilized Ad-AC infected PPC1 cell immunostained for cathepsin B. B: Ad-GFP or Ad-AC infected PPC1 cells were plated on an artificial matrix in the presence or absence of 1μM CA074 and immunostained for cathepsin B (red). One hundred cells from each treatment were counted for the presence of cathepsin B-rich invasive structures as indicated with the arrow. C: Cells were infected as indicated and plated in collagen coated transwells with or without CA074. Invasion through the matrix was analyzed after 24 hours.
Figure 5
Figure 5. Cathepsin B and AC are upregulated in prostate tumor tissues
A tissue microarray was assembled composed of patient matched tumor and normal adjacent tissue and immunostained for cathepsin B and AC. A blinded pathologist scored the tissues from 1 to 5 for strength of staining. For each patient, tumor score minus benign score was plotted for cathepsin B (ordinate) and AC (abscissa) (A). Red squares are indicative of tumors that were invasive at the time of resection or later recurred by post-surgical rebound of PSA levels. B: A single patient tumor and normal adjacent tissue slide showing representative AC and cathepsin B staining (brown).

References

    1. Jemal A, Siegel R, Xu J, Ward E. Cancer statistics, 2010. CA Cancer J Clin. 2010;60:277–300. - PubMed
    1. Stavridi F, Karapanagiotou EM, Syrigos KN. Targeted therapeutic approaches for hormone-refractory prostate cancer. Cancer Treat Rev. 36:122–30. - PubMed
    1. Katunuma N, Matsunaga Y, Saibara T. Mechanism and regulation of antigen processing by cathepsin B. Adv Enzyme Regul. 1994;34:145–58. - PubMed
    1. Foghsgaard L, Wissing D, Mauch D, Lademann U, Bastholm L, Boes M, Elling F, Leist M, Jaattela M. Cathepsin B Acts as a Dominant Execution Protease in Tumor Cell Apoptosis Induced by Tumor Necrosis Factor. J Cell Biol. 2001;153:999–1010. - PMC - PubMed
    1. Ha SD, Ham B, Mogridge J, Saftig P, Lin S, Kim SO. Cathepsin B-mediated autophagy flux facilitates the anthrax toxin receptor 2-mediated delivery of anthrax lethal factor into the cytoplasm. J Biol Chem. 2010;285:2120–9. - PMC - PubMed

Publication types