

Temporally-independent functional modes of spontaneous brain activity
- PMID: 22323591
- PMCID: PMC3286957
- DOI: 10.1073/pnas.1121329109
Temporally-independent functional modes of spontaneous brain activity
Abstract
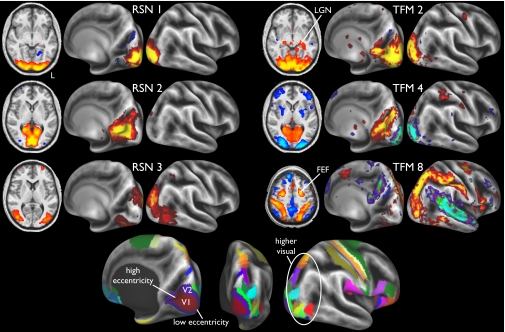
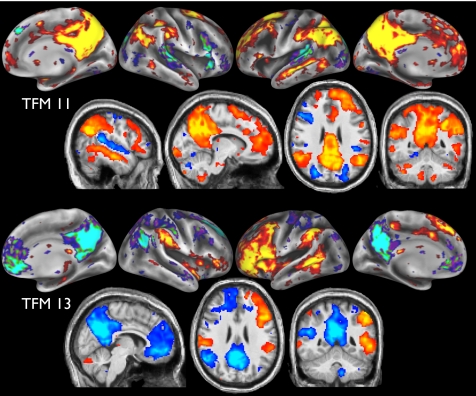
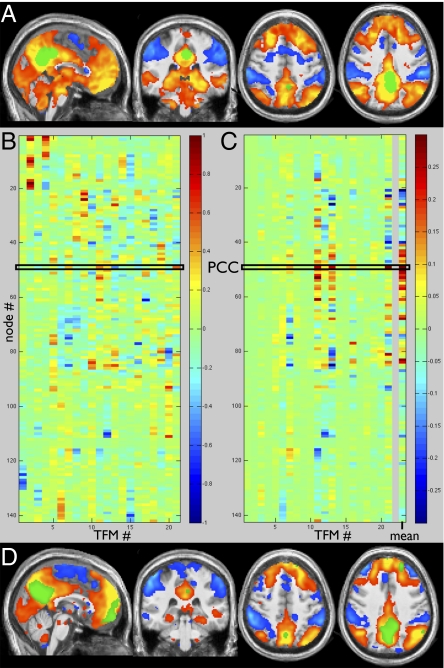
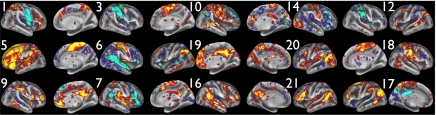
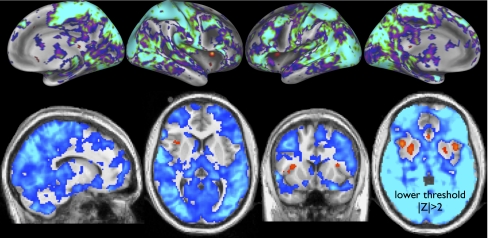
Resting-state functional magnetic resonance imaging has become a powerful tool for the study of functional networks in the brain. Even "at rest," the brain's different functional networks spontaneously fluctuate in their activity level; each network's spatial extent can therefore be mapped by finding temporal correlations between its different subregions. Current correlation-based approaches measure the average functional connectivity between regions, but this average is less meaningful for regions that are part of multiple networks; one ideally wants a network model that explicitly allows overlap, for example, allowing a region's activity pattern to reflect one network's activity some of the time, and another network's activity at other times. However, even those approaches that do allow overlap have often maximized mutual spatial independence, which may be suboptimal if distinct networks have significant overlap. In this work, we identify functionally distinct networks by virtue of their temporal independence, taking advantage of the additional temporal richness available via improvements in functional magnetic resonance imaging sampling rate. We identify multiple "temporal functional modes," including several that subdivide the default-mode network (and the regions anticorrelated with it) into several functionally distinct, spatially overlapping, networks, each with its own pattern of correlations and anticorrelations. These functionally distinct modes of spontaneous brain activity are, in general, quite different from resting-state networks previously reported, and may have greater biological interpretability.
Conflict of interest statement
The authors declare no conflict of interest.
Figures
References
-
- Biswal B, Yetkin FZ, Haughton VM, Hyde JS. Functional connectivity in the motor cortex of resting human brain using echo-planar MRI. Magn Reson Med. 1995;34:537–541. - PubMed
-
- Biswal BB, Ulmer JL. Blind source separation of multiple signal sources of fMRI data sets using independent component analysis. J Comput Assist Tomogr. 1999;23:265–271. - PubMed
Publication types
MeSH terms
Grants and funding
LinkOut - more resources
Full Text Sources
Other Literature Sources
