Comparative Study
. 2012 Feb 8;32(6):1942-52.
doi: 10.1523/JNEUROSCI.4556-11.2012.

Temporal order memory assessed during spatiotemporal navigation as a behavioral cognitive marker for differential Alzheimer's disease diagnosis

Affiliations
Comparative Study

Temporal order memory assessed during spatiotemporal navigation as a behavioral cognitive marker for differential Alzheimer's disease diagnosis

Virginie Bellassen et al. J Neurosci. .

Abstract

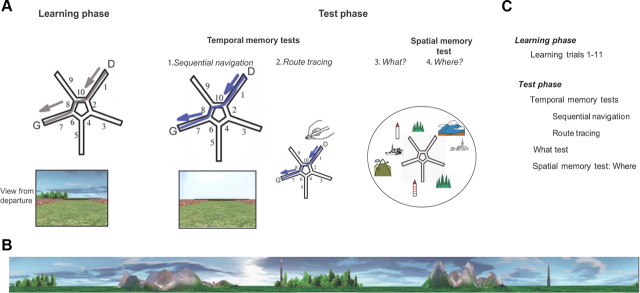
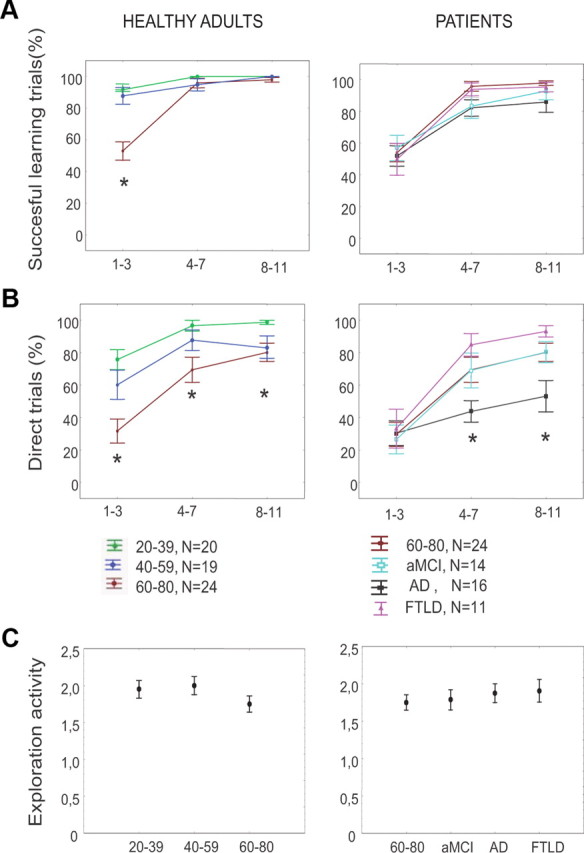
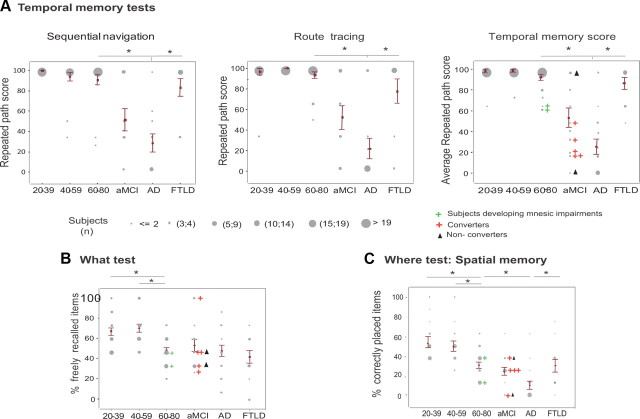
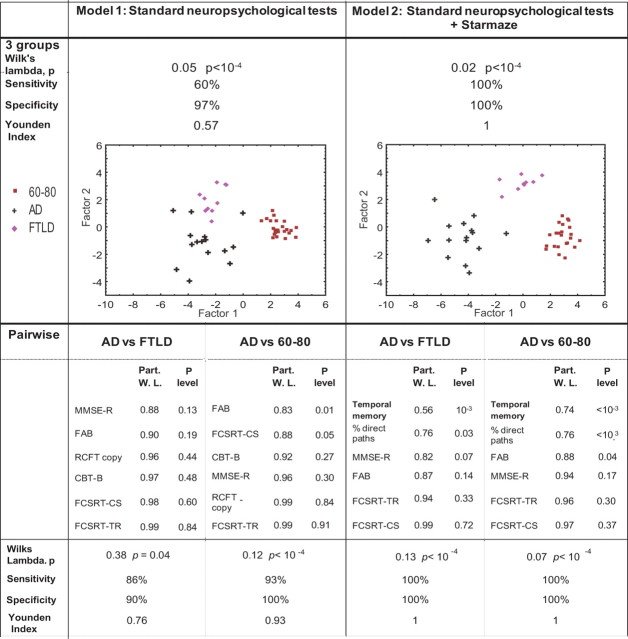
Episodic memory impairment is a hallmark for early diagnosis of Alzheimer's disease. Most actual tests used to diagnose Alzheimer's disease do not assess the spatiotemporal properties of episodic memory and lead to false-positive or -negative diagnosis. We used a newly developed, nonverbal navigation test for Human, based on the objective experimental testing of a spatiotemporal experience, to differentially Alzheimer's disease at the mild stage (N = 16 patients) from frontotemporal lobar degeneration (N = 11 patients) and normal aging (N = 24 subjects). Comparing navigation parameters and standard neuropsychological tests, temporal order memory appeared to have the highest predictive power for mild Alzheimer's disease diagnosis versus frontotemporal lobar degeneration and normal aging. This test was also nonredundant with classical neuropsychological tests. As a conclusion, our results suggest that temporal order memory tested in a spatial navigation task may provide a selective behavioral marker of Alzheimer's disease.


Figures

Figure 1.
Figure 1.
The Starmaze task. A, Tasks performed. The Starmaze is composed of a central pentagonal ring (alleys 2, 4, 6, 8, and 10) from which five centrally symmetric alleys (1, 3, 5, 7, and 9) radiate. D, Departure alley; G, goal alley, where a virtual reward appeared when the subject reached the goal. The learning phase. Subjects were told to navigate toward a fixed hidden reward (G), with the most direct path possible, starting from the same departure point (D). The ideal path toward the goal is shown in gray. For the first three learning trials, if the subject had not found the reward within time or distance limits, he was placed at the entrance of the goal alley (7) and an arrow indicated the way to the reward. The test phase. The temporal memory tests. (1) Sequential navigation: All environmental cues were removed; the virtual environment only consisted of the walls boarding the alleys. Participants were told to reproduce the sequence of turns performed on the last learning trial. (2) Route tracing: Participants had to trace the path they had performed on the last learning trial on a map of the maze. The “what” test: Participants were asked to name the visual cues they had seen in the environment (“what”). The spatial memory test-“where” test: Subjects had to place the recalled cues on the map of the Starmaze. B, Configuration of the virtual environment. The landmarks consisted of two different mountains and villages, two distinct forests and two antennas, which were located between the ends of two adjacent alleys. To encourage the participants to encode the relationships between environmental landmarks, these landmarks were presented in sets of two. C, Succession of tests.
Figure 2.
Figure 2.
Navigation performance in healthy adults (left) and patients (right) during the learning phase. Shown are the evolutions of navigation performances over learning trials, in each group. For display purposes, learning trials were grouped in three blocks (trials 1–3, 4–7, and 8–11). A, Percentage of successful learning trials, as defined by the capacity to reach the goal within the time and distance limits. B, Percentage of trials with direct paths to the goal. C, Exploration activity, defined as the number of peripheral alleys (excluding the start arm) that were visited during the first learning trial for the first time, and taken as a control of exploration activity. *p < 0.05, Group effect.
Figure 3.
Figure 3.
Temporally organized memory differentiates AD from normal aging and FTLD better than spatially organized memory. A, Performance on temporal memory tests. The repeated path score measured the percentage of the sequence of turns performed on learning trial 11 that were reproduced during the temporal memory tests. Left, Sequential navigation test. Middle, Route tracing on a survey map of the maze; Right, Temporal memory score (mean value of both temporal tests). B, The “what” test. Percentage of environmental cues freely recalled. C, Spatial memory test (“where”), as defined by the percentage of cues that are correctly placed on the environment layout. Gray dots represent individual scores. Their diameter is proportional to the number of subjects. Individual performances of two subjects from the 60–80 group whose memory performances declined over 18 months are shown (green crosses), as well as AD converters (red crosses) and nonconverters (black triangles). *p < 0.05, Scheffe post hoc test.
Figure 4.
Figure 4.
Comparison of the discriminating power of two models deprived (model 1) or not (model 2) of Starmaze tests equated for the number of variables. In both models, the 6 most discriminating variables from the preliminary discriminant analysis conducted on all variables were entered in the definitive discriminant analysis [Model 1: (1) FAB, (2) MMSE-R, (3) FCSRT-CS, (4) CBT-B, (5) RCFT copy, (6) FCSRT-TR; Model 2: (1) temporal memory score, (2) FAB, (3) percentage of direct paths on learning trial 11, (4) MMSE-R, (5) FCSRT-CS, (6) FCSRT-TR). Top, Classifier performances for both models performed on the 60–80, AD and FTLD groups. Graphs represent individual classifications along both factors extracted from the discriminant analysis. The more the groups are separated, the more the model discriminates. Bottom, Discriminant analysis on pairs of groups. In each pairwise model of models 1 and 2, significant variables are extracted and, below, classifier performances are shown. FR, Free recall; TR, total recall; CS, sensitivity to cueing (%); W. L., partial Wilks lambda.

References

    1. Antonova E, Parslow D, Brammer M, Dawson GR, Jackson SH, Morris RG. Age-related neural activity during allocentric spatial memory. Memory. 2009;17:125–143. - PubMed
    1. Berg L. Clinical Dementia Rating (CDR) Psychopharmacol Bull. 1988;24:637–639. - PubMed
    1. Bird CM, Burgess N. The hippocampus and memory: insights from spatial processing. Nat Rev Neurosci. 2008;9:182–194. - PubMed
    1. Bird CM, Chan D, Hartley T, Pijnenburg YA, Rossor MN, Burgess N. Topographical short-term memory differentiates Alzheimer's disease from frontotemporal lobar degeneration. Hippocampus. 2010;20:1154–1169. - PubMed
    1. Braak H, Braak E. Neuropathological stageing of Alzheimer-related changes. Acta Neuropathol. 1991;82:239–259. - PubMed

Publication types

MeSH terms