Comparative Study
. 2012 Feb 8;32(6):2166-81.
doi: 10.1523/JNEUROSCI.5297-11.2012.

Ca²⁺/cAMP-sensitive covariation of I(A) and I(H) voltage dependences tunes rebound firing in dopaminergic neurons

Affiliations
Comparative Study

Ca²⁺/cAMP-sensitive covariation of I(A) and I(H) voltage dependences tunes rebound firing in dopaminergic neurons

Julien Amendola et al. J Neurosci. .

Abstract

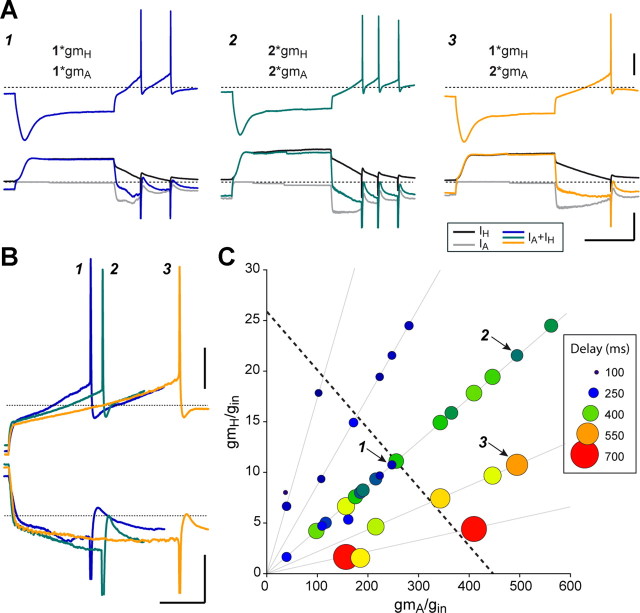
The level of expression of ion channels has been demonstrated to vary over a threefold to fourfold range from neuron to neuron, although the expression of distinct channels may be strongly correlated in the same neurons. We demonstrate that variability and covariation also apply to the biophysical properties of ion channels. We show that, in rat substantia nigra pars compacta dopaminergic neurons, the voltage dependences of the A-type (I(A)) and H-type (I(H)) currents exhibit a high degree of cell-to-cell variability, although they are strongly correlated in these cells. Our data also demonstrate that this cell-to-cell covariability of voltage dependences is sensitive to cytosolic cAMP and calcium levels. Finally, using dynamic clamp, we demonstrate that covarying I(A) and I(H) voltage dependences increases the dynamic range of rebound firing while covarying their amplitudes has a homeostatic effect on rebound firing. We propose that the covariation of voltage dependences of ion channels represents a flexible and energy-efficient way of tuning firing in neurons.


Figures

Figure 1.
Figure 1.
Identification of SNc dopaminergic neurons and dissection of rebound properties. A, Infrared image of a dopaminergic neuron and the patch pipette. B, Left, Fluorescent streptavidin labeling of a neuron filled with neurobiotin. Right, Tyrosine hydroxylase immunolabeling of the same neuron. C, Characteristic electrophysiological properties of SNc dopaminergic neurons. Top row, Left, Current-clamp recording showing the typical pacemaker tonic firing of a dopaminergic neuron. Right, Histogram of the log-normal distribution of the interspike interval (inverse of the instantaneous frequency). Bottom row, Left, Current-clamp recording showing the typical slow action potential waveform of a dopaminergic neuron. Right, Histogram of the log-normal distribution of action potential half-width. Dashed lines indicate −60 mV. D, Rebound waveform in SNc dopaminergic neurons. Top, Current-clamp recording of a typical response of a neuron to a 1 s hyperpolarizing current step leading to −120 mV, showing the clear kink in the repolarization. The gray trace represents the current step from 0 to −125 pA. Bottom, The rebound elicited by short diexponential synaptic-like pulses also displayed a biphasic repolarization. The gray trace represents the −287 pA current injection. E, Expanded version corresponding to the gray box in D. Two phases of repolarization (phase I, phase II) are distinguished based on the rate of repolarization. The transition point was named “kink” and the corresponding voltage Vkink. F, Scatter plots summarizing the correlation between rebound delay and Vkink. Top, Scatter plot showing the relationship between rebound delay elicited by 1 s steps (gray circles) or short synaptic-like (black circles) hyperpolarizing stimuli. Bottom, Scatter plot illustrating the significant correlation between log (rebound delay) and Vkink for long hyperpolarizations (R, p, and n values are on the plot). G, Scatter plots summarizing the correlation between rebound delay and phase II slope. Top, Scatter plot showing the relationship between rebound delay and phase II slope elicited by 1 s (gray circles) or short synaptic-like (black circles) hyperpolarizing pulses. Bottom, Scatter plot illustrating the significant correlation between log (rebound delay) and log (phase II slope) for long hyperpolarizations (R, p, and n values are on the plot). Scale bars: A, B, 20 μm. Calibration: C, Top, 20 mV, 1 s; C, Bottom, 20 mV, 2 ms; D, Top, 20 mV, 200 ms; D, Bottom, 20 mV, 200 ms; E, 20 mV, 20 ms.
Figure 2.
Figure 2.
Characterization of AmmTX3 activity in SNc dopaminergic neurons. A, AmmTX3 blocks IA without modifying gating properties. Left, Voltage-clamp recordings of IA (step to −40 mV from holding potentials of −40, −60, −70, and −80 mV shown beneath traces) obtained from the same neuron in control conditions (top, black traces) and in the presence of 100 nm AmmTX3 (bottom, gray traces). Right, Inactivation curves corresponding to the traces presented on the left. Note that AmmTX3 only reduces the amplitude of the current without modifying the inactivation properties. B, Dose–response curve of the effect of AmmTX3 on IA amplitude in SNc dopaminergic neurons in acute brain slices. Numbers above the points indicate the number of cells used for the quantification of the effect of the toxin at different concentrations. C, 300–600 nm AmmTX3 blocks IA but does not affect the delayed rectifier potassium current (n = 5) or IH (n = 4). Top, Voltage-clamp recordings of IA (left, step to −40 mV from a −100 mV prestep shown beneath traces) and the delayed rectifier potassium current (right, step to −10 mV from a −40 mV prestep shown beneath traces) from the same neuron in control (black traces) and in the presence of 300 nm AmmTX3 (gray traces). Bottom, Voltage-clamp recordings of IA (left, step to −40 mV from a −100 mV prestep shown beneath traces) and IH (right, step to −110 mV from a −60 mV prestep shown beneath traces) from the same neuron in control (black traces) and in the presence of 300 nm AmmTX3 (gray traces). Note that while IA is almost completely abolished by toxin application, the potassium-delayed rectifier current and IH are not affected. D, AmmTX3 has the expected effect of IA blockers on spontaneous pacemaker activity. Top and Middle, Current-clamp recordings of spontaneous activity in a neuron in control condition (top) and in the presence of 300 nm AmmTX3 (middle). Bottom, Scatter plot showing the significant increase in spontaneous frequency induced by 300 nm AmmTX3 in nine SNc dopaminergic neurons. Dashed lines indicate −60 mV (current-clamp) or 0 pA (voltage-clamp). **p < 0.01. Calibration: A, 2 nA, 100 ms; C, Top right and left, 2 nA, 200 ms; C, Bottom left, 1 nA, 100 ms; C, Bottom right, 250 pA, 500 ms; D, 20 mV, 2.5 s.
Figure 3.
Figure 3.
Effects of specific blockers of IA and IH on rebound properties. A, Rebound response induced by a 1 s hyperpolarizing pulse (−84.0 mV at the end of the pulse) in control (top trace), in the presence of 300 nm AmmTX3 (middle trace), and in the presence of AmmTX3 + 3 μm ZD7288 (bottom trace). Bottom, Bar plot showing the average rebound delay values before and after the application of AmmTX3 and ZD7288. B, Rebound response induced by a 1 s hyperpolarizing pulse (−71.9 mV at the end of the pulse) in control (top trace), in the presence of 3 μm ZD7288 (middle trace), and in the presence of ZD7288 + 300 nm AmmTX3 (bottom trace). Bottom, Bar plot showing the average rebound delay before and after the application of AmmTX3 and ZD7288. C, Same experimental protocol as in A, but using short synaptic-like hyperpolarizations (−84.9 mV at the peak) to induce the rebound. Bottom, Bar plot showing the average rebound delay before and after AmmTX3 and ZD7288 application. D, Same experimental protocol as in B, but using short synaptic-like hyperpolarizations (−71.9 mV at the peak) to induce the rebound. Bottom, Bar plot showing the average rebound delay values before and after AmmTX3 and ZD7288 application. The gray traces in AD represent the current stimulus. *p < 0.05, **p < 0.01, ***p < 0.001. Dashed lines in traces indicate −60 mV. Calibration: AD, 20 mV, 500 ms.
Figure 4.
Figure 4.
Variability and covariation of IA and IH biophysical properties. A, Top, Voltage-clamp recordings of IH in two dopaminergic neurons in response to hyperpolarizing pulses at −80, −100, and −120 mV from a holding potential of −60 mV, followed by a pulse at −130 mV. Bottom, Voltage-clamp recordings of IA in the same cells in response to a depolarizing pulse to −60, −50, and −40 mV from a holding potential of −100 mV. Dashed lines indicate 0 pA. B, Scatter plots showing the variability in amplitude of IH maximum current recorded at −130 mV (left) and IA recorded at −40 mV (right). Black and gray lines indicate the mean and SD, respectively. C, Scatter plots showing the variability in the voltage dependence of activation of IH (left) and inactivation of IA (right). Black and gray lines indicate the mean and SD, respectively. D, Left, IH activation (dashed line) and IA inactivation (solid line) curves corresponding to the cells presented in A. Right, Scatter plot showing the significant positive correlation between IH activation and IA inactivation V50 values. In BD, the black and gray circles correspond to the voltage-clamp recordings of the two neurons presented in A. E, Left, Scatter plot showing the relationships between the time after breaking into whole-cell configuration and IA inactivation (small empty circles) or IH activation (small gray circles) V50 values for the cells presented in Figure 4D, right. Large circles represent the average values of IA inactivation (black) and IH activation (gray) V50 values for each 5 min time window following break-in to whole-cell configuration (the n for each 5 min time window is indicated at the top and bottom of the plot). Note the lack of a significant correlation between IA inactivation V50 values and time following break-in, and the significant correlation between the time following break-in and IH activation V50 values (R, p, and n values are indicated on the plot). Right, Plot showing no change between the average IA inactivation V50 values in the same cells (n = 10) recorded immediately after obtaining whole-cell configuration (0–1 min) and again after 9–16 min. Calibration: A, Top, 500 pA, 2 s; Bottom, 4 nA, 200 ms. Error bars represent SD.
Figure 5.
Figure 5.
IA and IH covariation of voltage dependences is sensitive to cytosolic calcium and cAMP concentrations. A, Scatter and box plots illustrating the effect of BAPTA on IH activation and IA inactivation voltages. Compared with the control population (A–C, gray circles/boxes; n = 109 and 95 for IA inactivation and IH activation V50 values, respectively), the addition of 5 mm BAPTA to the patch pipette (white circles/boxes) significantly depolarizes the inactivation V50 of IA (n = 22), but not the activation V50 of IH (n = 22). The replacement of EGTA with 10 mm BAPTA in the patch pipette (black circles/boxes) significantly depolarizes both IA inactivation and IH activation V50 values (n = 38 and 35, respectively). B, Scatter and box plots showing the effects of ddA and 8-Br-cAMP on IA inactivation and IH activation V50 values. ddA (white circles/boxes) significantly hyperpolarized IH activation V50 (n = 22), but did not significantly shift IA inactivation V50 (n = 28). 8-Br-cAMP (black circles/boxes) significantly depolarized both IA inactivation (n = 21) and IH activation (n = 17) V50 values. C, Scatter and box plots illustrating the effect of the coapplication of 10 mm BAPTA and 8-Br-cAMP on IA inactivation and IH activation V50 values. Data show that 10 mm BAPTA/8-Br-cAMP (black circles/boxes) significantly depolarized IA inactivation (n = 24) and IH activation (n = 22) V50 values (black asterisks), and also significantly reduced the variability (gray asterisks, F test) for both IA inactivation and IH activation V50 values compared with the control population. D, Scatter plot illustrating the negative linear regression (R = −0.663, p < 0.001) present between IA inactivation V50 and the amplitude of IA measured at −40 mV in the control population (gray circles), and the alignment of the average values for the control population (large gray circle), 5 mm BAPTA (white square), 10 mm BAPTA (black square), and 10 mm BAPTA/8-Br-cAMP conditions (gray diamond) along this regression line. Box-and-whisker plots in A–C represent the median value and first and third quartiles (box), and the minimum and maximum values of the distribution (whiskers). Error bars in D represent SD. *p < 0.05, **p < 0.01, ***p < 0.001.
Figure 6.
Figure 6.
Summary of correlations between IA and IH biophysical properties and firing parameters. A, Scatter plot showing the significant positive correlations between the Vkink and IA inactivation (black) and IH activation (gray) V50 values. Gray lines indicate the linear regressions for IA and IH V50 values (R, p, and n values are at the top left and bottom right of the plot), respectively. B, Scatter plot illustrating the significant correlation between IA τh and phase II slope. The gray line (inset) indicates the linear regression between the log transforms of the variables. C, Scatter plot representing the absence of correlations between action potential threshold and IA (black) and IH (gray) V50 values. The dashed gray line indicates the linear regressions (R, p, and n values are on the plot). D, Scatter plot representing the absence of correlations between action potential peak and IA (black) and IH (gray) V50 values. The dashed gray line indicates the linear regressions (R, p, and n values are on the plot).
Figure 7.
Figure 7.
Dynamic-clamp simulation of IA and IH reproduces rebound profile. A, Activation curves of IH and IA and inactivation curve of IA from the biological currents used for the dynamic clamp. B, Voltage dependence of the time constant of activation of IH. The black line indicates the Gaussian fit of the experimental measures of the time constant of activation of IH (gray circles, n = 27) used for the dynamic-clamp model. C, D, Voltage dependence of the time constants of activation (C) and inactivation (D) of IA. The black line indicates the sigmoidal fit of the experimental values (gray circles, n = 19) used for the dynamic-clamp model. E, Experimental traces (gray) and dynamic-clamp simulation (black) of IH (voltage steps to −80, −100, −120 mV from −60 mV) and IA (steps to −60, −50, −40 mV from −100 mV). F, Current-clamp recordings showing the rebound profile of a neuron in control condition (gray trace, top left and right), after complete blockade of IA and IH (2 μm AmmTX3, 30 μm ZD7288, bottom left), and after injection of the simulated IA and IH (black trace, top right). Bottom right, Dynamic-clamp IH (upper gray trace) and IA (lower gray trace) currents injected into the neuron during the rebound protocol. The black trace (bottom right) corresponds to the sum of the two currents. Dashed lines indicate −60 mV (current-clamp) or 0 pA (voltage clamp, dynamic clamp). Calibration: E, Top, 500 pA, 2 s; E, Bottom, 2 nA, 200 ms; F, 20 mV/100 pA, 250 ms. See Table 1.
Figure 8.
Figure 8.
Dynamic clamp reproduces the effects of partial inhibition of IA and IH. A, Rebound profile (top, black trace) of a neuron in response to the injection of average IA (100% gmA, bottom, light gray trace) and IH (100% gmH, bottom, black trace) conductances. B, Rebound profile in the same neuron (top, black trace) with 20% gmA and 100% gmH. C, Rebound profile in the same neuron (top, black trace) with 20% gmH and 100% gmA. D, Left column, Bar plots summarizing the effects of reducing gmA (20% gmA) or gmH (20% gmH) on rebound delay, phase II slope, and Vkink. Right column (shaded box), Bar plots summarizing the effect of blocking 60–85% of the IA and IH currents with AmmTX3 and ZD7288, respectively, on the different rebound parameters. The bar plots showing the effect of AmmTX3 and ZD7288 on rebound delay were also presented in Figure 3A. Dashed lines indicate −60 mV (current-clamp) or 0 pA (dynamic clamp). *p < 0.05, **p < 0.01, ***p < 0.001.
Figure 9.
Figure 9.
Effects of varying gmA and gmH on rebound delay. A, Example traces showing the rebound profile (top traces) of the same neuron in response to the dynamic-clamp injection (IH, bottom black trace; IA, bottom gray trace; total injected current, bottom color trace) of various combinations of gmH and gmA: (1) 1 * gmH, 1 * gmA, (2) 2 * gmH, 2 * gmA, and (3) 1 * gmH, 2 * gmA with gmH = 16.6 nS and gmA = 380 nS. The numbers are used to identify the corresponding traces and points in B and C. B, Expanded superimposed current-clamp (top) and dynamic-clamp (bottom) traces corresponding to the traces shown in A. C, Summary bubble plot showing the effect of varying gmA and gmH on rebound delay. Increasing delay is coded by both color and size of the bubble: small blue bubbles correspond to short delays while big red bubbles correspond to long delays. Gray lines indicate constant ratio directions in parameter space. The dashed line corresponds to the direction of best sensitivity of delay in parameter space calculated by multiple linear regression of delay versus gmA and gmH (delay = 270 + 8.4 * gmA − 146 * gmH). In this plot, gmA and gmH were normalized to the input conductance of the neuron and do not have dimensions. Dashed lines indicate −60 mV (current-clamp) or 0 pA (dynamic clamp). Calibration: A, Top, 20 mV; A, Bottom, 200 pA 500 ms; B, Top, 20 mV; B, Bottom, 200 pA, 150 ms.
Figure 10.
Figure 10.
Effects of covarying IH and IA voltage dependences on rebound delay. A, Left, Example current-clamp traces showing the rebound profile in the same neuron in response to the dynamic-clamp injection of “biological” combinations of voltage dependences of IA and IH (traces 1–3 correspond to depolarized, average biological values, and hyperpolarized V50 values, respectively; see C, corresponding points). Right, Example current-clamp traces showing the rebound profile in the same neuron in response to the dynamic-clamp injection of nonbiological “orthogonal” combinations of voltage dependences of IA and IH (traces 5, 2, and 4 correspond to hyperpolarized IH V50 and depolarized IA V50, average biological V50 values, and depolarized IH V50 and hyperpolarized IA V50 respectively; see corresponding points in C). B, Expanded current-clamp (top) and dynamic-clamp (bottom) traces corresponding to the traces presented in A. C, Summary bubble plot showing the effect of varying IA and IH voltage dependences on rebound delay. Variations in delay are coded by the size of the black bubbles. Filled light-gray circles correspond to the biological distribution of V50 values (Fig. 4D) and the gray line indicates the linear regression of these values. The dashed line corresponds to the direction orthogonal to the biological distribution. Numbers correspond to the traces presented in A and B. Asterisks indicate significant differences in delay compared with the mean value (2). ns, Nonsignificant. Calibration: A, 20 mV, 250 ms; B, Top, 20 mV; Bottom, 200 pA, 100 ms. Dashed lines indicate −60 mV (current-clamp) or 0 pA (dynamic clamp).
Figure 11.
Figure 11.
Comparing the effects of varying IH and IA voltage dependences or maximum conductances. Bubble plot showing the variations in normalized rebound delay (bubble diameter) associated with variable ratios of gmA/gmH (horizontally aligned bubbles) and the three different biological combinations of covarying voltage dependences of IH and IA (vertically aligned bubbles). Note that the changes in delay induced by a fourfold change in gmA/gmH and by a 15/8.7 mV shift in voltage dependences are of similar magnitude (small bubbles vs large bubbles).

Comment in

References

    1. An WF, Bowlby MR, Betty M, Cao J, Ling HP, Mendoza G, Hinson JW, Mattsson KI, Strassle BW, Trimmer JS, Rhodes KJ. Modulation of A-type potassium channels by a family of calcium sensors. Nature. 2000;403:553–556. - PubMed
    1. Anderson D, Mehaffey WH, Iftinca M, Rehak R, Engbers JD, Hameed S, Zamponi GW, Turner RW. Regulation of neuronal activity by Cav3-Kv4 channel signaling complexes. Nat Neurosci. 2010;13:333–337. - PubMed
    1. Biel M, Wahl-Schott C, Michalakis S, Zong X. Hyperpolarization-activated cation channels: from genes to function. Physiol Rev. 2009;89:847–885. - PubMed
    1. Birnbaum SG, Varga AW, Yuan LL, Anderson AE, Sweatt JD, Schrader LA. Structure and function of Kv4-family transient potassium channels. Physiol Rev. 2004;84:803–833. - PubMed
    1. Burdakov D. Gain control by concerted change in IA and IH conductances. Neural Comput. 2005;17:991–995. - PMC - PubMed

Publication types

Substances

LinkOut - more resources