Comparative Study
. 2012 Feb 8;32(6):2191-203.
doi: 10.1523/JNEUROSCI.3998-11.2012.

Remembering to learn: independent place and journey coding mechanisms contribute to memory transfer

Affiliations
Comparative Study

Remembering to learn: independent place and journey coding mechanisms contribute to memory transfer

Amir S Bahar et al. J Neurosci. .

Abstract

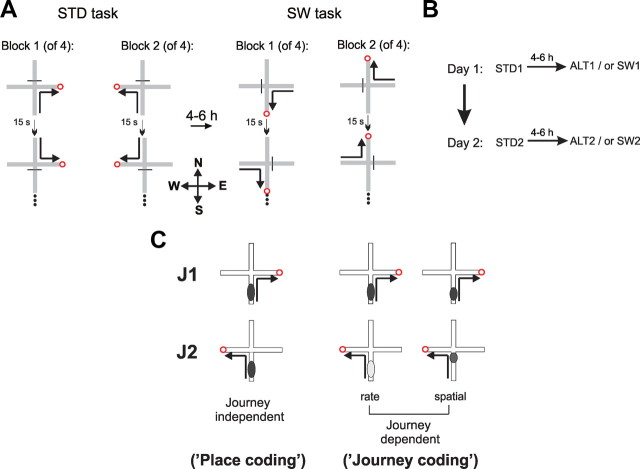
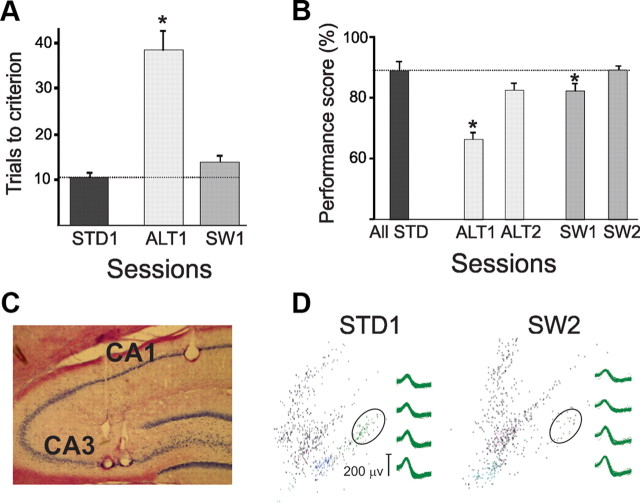
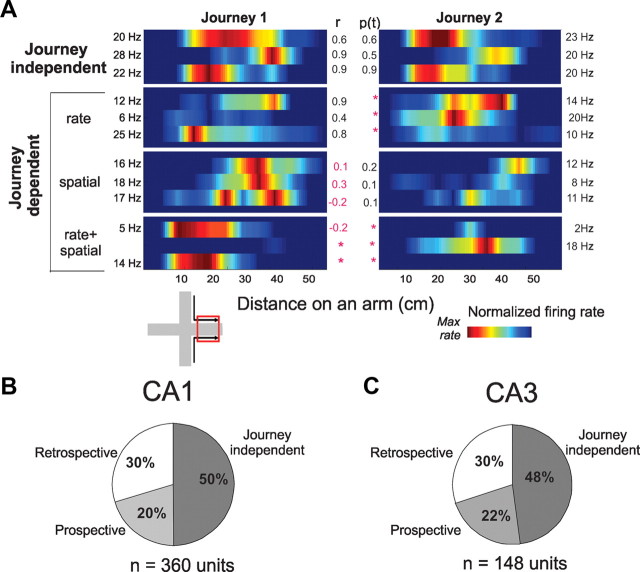
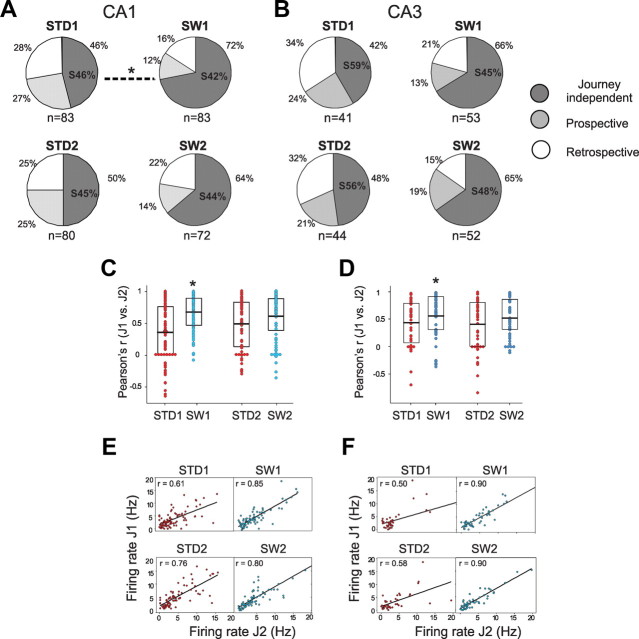
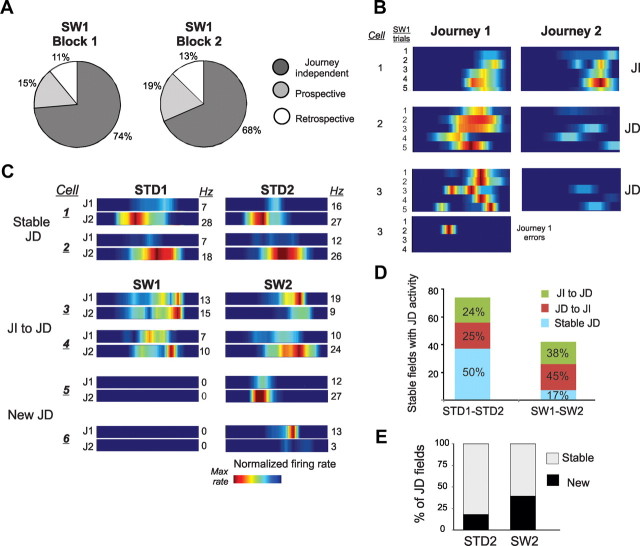
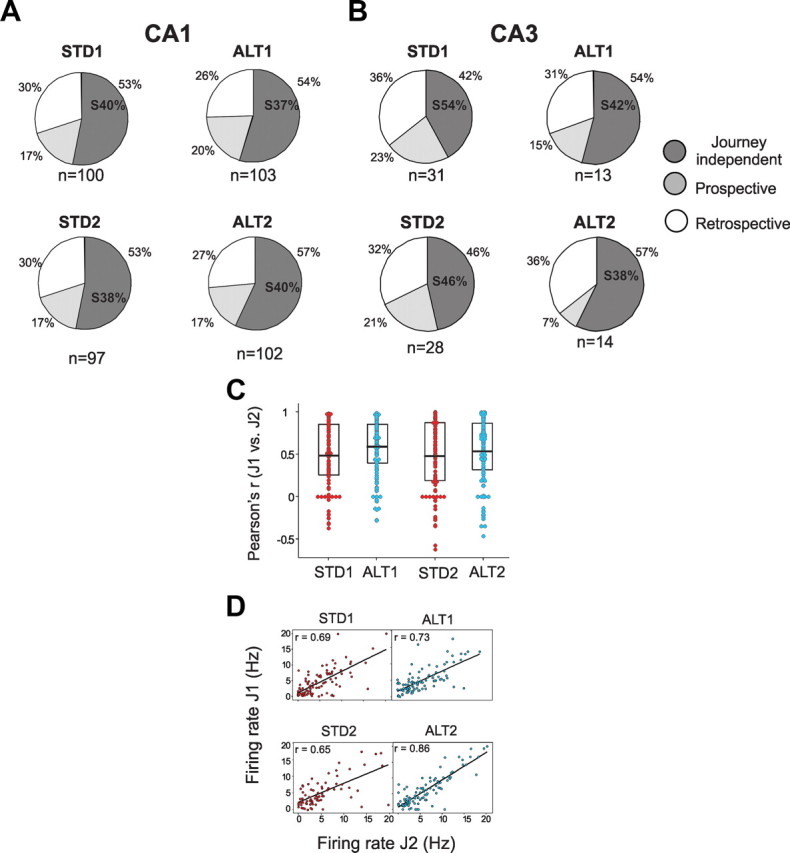
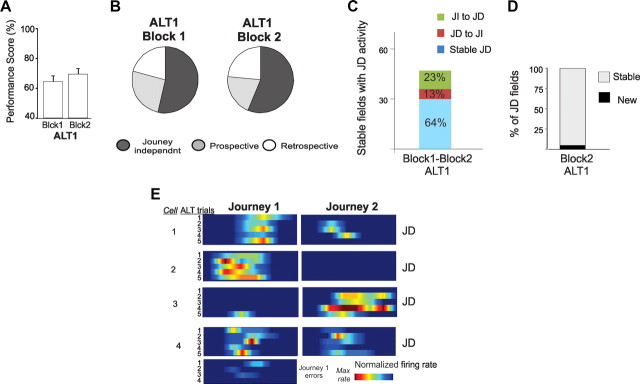
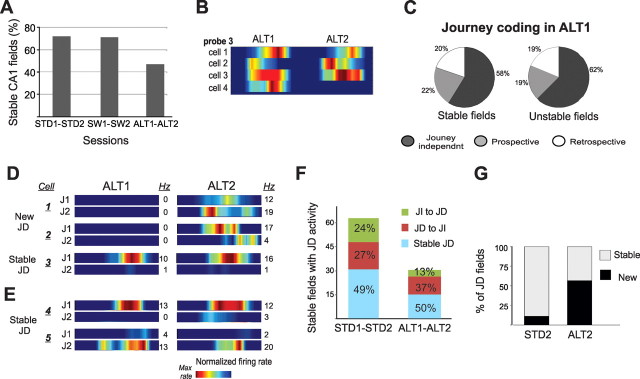
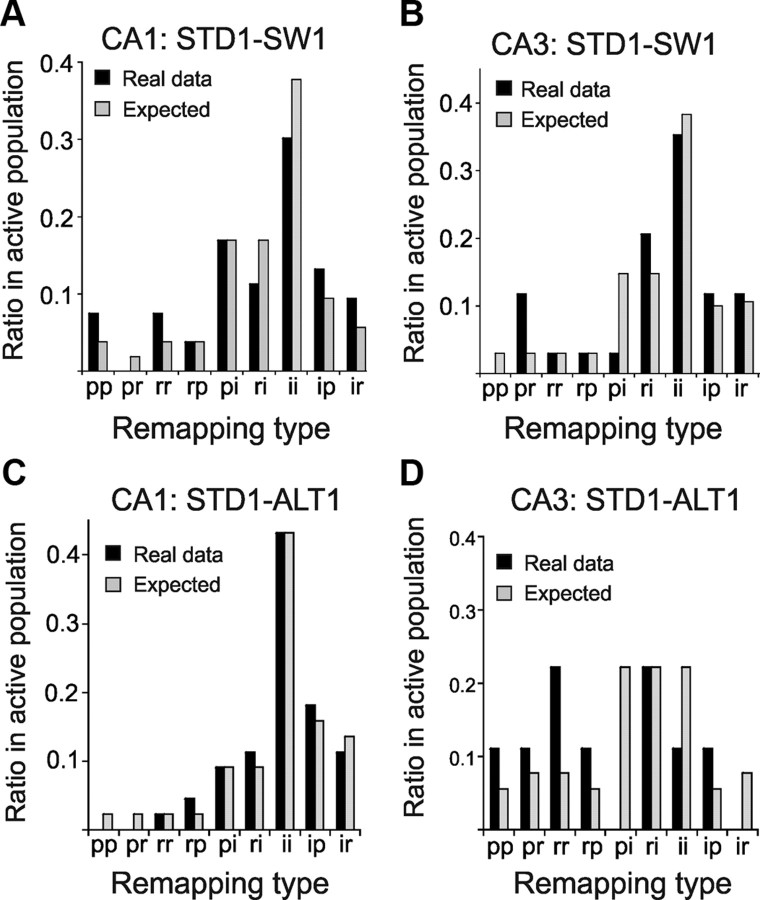
The neural mechanisms that integrate new episodes with established memories are unknown. When rats explore an environment, CA1 cells fire in place fields that indicate locations. In goal-directed spatial memory tasks, some place fields differentiate behavioral histories ("journey-dependent" place fields) while others do not ("journey-independent" place fields). To investigate how these signals inform learning and memory for new and familiar episodes, we recorded CA1 and CA3 activity in rats trained to perform a "standard" spatial memory task in a plus maze and in two new task variants. A "switch" task exchanged the start and goal locations in the same environment; an "altered environment" task contained unfamiliar local and distal cues. In the switch task, performance was mildly impaired, new firing maps were stable, but the proportion and stability of journey-dependent place fields declined. In the altered environment, overall performance was strongly impaired, new firing maps were unstable, and stable proportions of journey-dependent place fields were maintained. In both tasks, memory errors were accompanied by a decline in journey codes. The different dynamics of place and journey coding suggest that they reflect separate mechanisms and contribute to distinct memory computations. Stable place fields may represent familiar relationships among environmental features that are required for consistent memory performance. Journey-dependent activity may correspond with goal-directed behavioral sequences that reflect expectancies that generalize across environments. The complementary signals could help link current events with established memories, so that familiarity with either a behavioral strategy or an environment can inform goal-directed learning.


Figures

Figure 1.
Figure 1.
Experimental design and journey-dependent activity. A, Rats were trained in a spatial win-stay task with serial reversals on a plus maze. In the familiar STD task, the North and South arms were defined as start arms and the East and West arms were defined as goal arms. In each trial the rat was placed on one of the start arms and could find food at the end of one goal arm. After completing at least 9 of 10 correct trials to a particular goal, reward location was reversed to the other goal arm (Block 2). After reaching asymptotic performance, rats were implanted with tetrodes and neural activity in hippocampal CA1, and CA3 layers was recorded during STD performance. After 4–6 h the same neural population was recorded while rats performed the SW task for the first time. In the SW, start and goal locations were exchanged, so that the rat was placed on either West or East arm and could find reward at the end of either the North or South arms. A separate experiment recorded hippocampal activity as rats performed the STD task, and a few hours later the same task in an altered room (ALT, data not shown). The ALT task followed the same rules and procedures as the STD, but most local and distal room cues were unfamiliar. B, The same populations of cells were recorded during the four recording sessions over 2 d. C, Journey-independent place fields were defined by cells with statistically similar activity patterns on a given maze arm (a start arm here) during corresponding journeys toward different goals (J1 vs J2). Journey-dependent place fields were defined by statistically distinct firing rates or locations on a given arm. Place coding was defined operationally by journey-independent place fields; journey coding was defined operationally by journey-dependent place fields.
Figure 2.
Figure 2.
Memory performance and hippocampal recording. A, The number of trials to criterion (80%) was significantly greater in the first ALT session (ALT1) than either the first STD or SW sessions (STD1 and SW1, respectively). Error bars show standard error of the mean. B, Mean performance decreased during ALT1 compared to STD1, but in the second ALT session (ALT2) performance did not differ from the second STD session (STD2). Mean performance decreased slightly but significantly during the SW1 session compared to the STD1 session. C, Electrolytic lesions indicate the tips of recording tetrodes in CA1 and CA3 in this representative coronal brain section. D, Spike cluster maps of two recordings made by one tetrode in CA3 show spikes recorded in the first (STD1) and last (SW2) recording session. Firing patterns were more similar during repeated recording sessions of the same task (e.g., STD1 and STD2) than during different tasks (e.g., STD1 and SW2). The clusters surrounded by the ellipses show spikes recorded from the same cell that fired less during SW2 than STD1 (see representative waveforms).
Figure 3.
Figure 3.
Firing rate maps and journey-dependent activity during STD sessions. A, Color-coded firing rate maps compare examples of single unit activity across corresponding journeys (1 and 2, e.g., in the East arm, left inset). Each horizontal bar shows the mean firing rate of one cell along one arm during a STD session; adjacent bars show the same cell on the same arm during corresponding journeys. Rate maps, smoothed here but not in statistical analyses, show firing rates normalized to each cell's maximum in each journey (listed at the edge of each panel). Pearson's r (center left) and Student's t (p value, center right) compared the distributions across journeys, with significant differences shown in red. The top panel shows three cells with journey-independent place fields; the lower three panels show examples of nine cells with journey-dependent place fields that differed either by mean firing rate (second from top), spatial distribution (third panel from top), or both (bottom). The mean infield firing rate of journey-independent place fields (5.04 spikes/s) was higher then journey-dependent place fields (3.74 spikes/s; t(370) = 3.39, p < 0.001), as would be expected if firing during preferred journeys was similar to journey-independent place fields, and decreased during nonpreferred journeys. B, C, The pie charts show proportions of journey-independent and journey-dependent (prospective and retrospective) place fields in CA1 (B) and CA3 (C) during all STD sessions. The proportions were similar between CA1 and CA3.
Figure 4.
Figure 4.
Journey-dependent activity during the SW task. A, B, The proportion of cells with journey-dependent activity declined during SW1 compared with STD1 in both CA1 (A) and CA3 (B), although the decline was statistically significant only in CA1 (marked by an asterisk above the dotted line). Journey-dependent activity was separated into prospective and retrospective categories. The ratio of cells with journey-independent activity located on the start arms is depicted within the journey-independent area (S%). The number of total active cells included in each dataset is indicated below each pie. The decline in journey-dependent activity was also shown by increased spatial correlations of mean firing rates calculated for the whole maze arm across journeys (C, D). The boxes show the interquartile range and the bold lines indicate the mean. The average spatial correlations of all active cells increased significantly during the SW1, but not the SW2 sessions. Similarly, the correlations (r) between journeys (J1 and J2) were significantly greater during SW1 than STD1 when the mean firing rates was calculated for each maze arms (collapsing grid units) in both CA1 (E) and CA3 (F).
Figure 5.
Figure 5.
Journey dependent activity was relatively rare and unstable during SW1. A, Neural data were divided into the first and last block of 4–5 correct trials in a SW recording session. Performance was stable between the first and second half of the session (correct and error trials included; percentage correct: block 1 = 81.7, block 2 = 82.7). Proportions of cells that had journey-dependent activity increased slightly between the first and second block of 5 correct SW trials. B, The firing rate maps show spiking activity of three CA1 cells during the first 10 correct and behaviorally reliable SW trials. The lowest panel shows activity of cell 3 during four error trials. JD, Journey dependent; JI, Journey independent. C, Examples of JD activity dynamics across sessions. The firing rate maps show activity between journeys (J1 and J2) in repeated STD and SW sessions. The plurality of cells had stable JD activity between STD sessions (Stable JD). Many cells had different journey-related activity across repeated SW sessions (JI to JD, where JI is journey independent), while other cells inactive during SW1 had JD place fields in SW2 (New JD). D, The number of place fields that were identified in both repeated sessions (stable place fields) and were journey dependent in that at least one session was higher across repeated STD than SW sessions, indicated by the height of the stacked bars (STD1 versus STD2, left; SW1 versus SW2, right). The smaller height of the SW bars reflects the decline of journey coding in this task rather than a reduction in the number of place fields. The fate of these stable place fields with respect to journey coding is shown by the colors in the stacked bars (green: JI to JD; red: JD to JI; aqua: stable JD). In the STD, 50% of the stable place fields that showed journey coding in either session maintained the same type of journey coding across both sessions; in the SW only 17% maintained the same journey coding across sessions. Stable JD place fields were more common in STD than SW sessions (χ2(2) = 13, p = 0.002). E, The stacked columns show the proportion of journey-dependent place fields recorded in the second session that had a place field of any type in the first session. The gray stack shows the proportion of cells with journey-dependent place fields in STD2 that also had place fields in STD1; the black stack shows the proportion of cells that had no place field in STD1 (left column). These proportions were significantly different across repeated SW sessions (right column). New JD place fields were significantly more common in the SW2 than the STD2 session (χ2(1) = 7, p = 0.008).
Figure 6.
Figure 6.
Journey-dependent activity was maintained during ALT trials. A, B, The pie charts show the proportions of CA1 (A) and CA3 cells (B) with journey-independent or journey-dependent activity (prospective or retrospective) in correct trials in STD and ALT sessions cells. Journey-dependent activity is separated into prospective and retrospective categories. The proportion of journey-independent place fields on the start arms is typed within the journey-independent area (S%). The total number of active cells included in each dataset is indicated below each pie. The proportions of cells with journey-independent and journey-dependent activity were similar between the STD and ALT tasks in both layers (note the low number of CA3 cells active during the ALT). The analyses that examined the entire population of active CA1 cells confirmed these observations. C, The average spatial correlation of firing rates on the arms between journeys was similar between the all STD and ALT sessions. D, The mean firing rates calculated for the entire arms were similar across journeys in STD1 and ALT1. The same measure showed greater journey coding in STD2 than ALT2 (r: STD2 = 0.65, ALT2 = 0.86, Z = 3.6, p < 0.001). Too few CA3 cells were active during the ALT task to support these analyses.
Figure 7.
Figure 7.
JD activity in CA1 was stable during the first and last block of 5 correct trials in ALT1. A, B, Memory performance (A) and the proportions of journey-independent (JI) and journey-dependent (JD) place fields (B) were similar in both blocks. C, The number of place fields that were identified in both blocks of the first ALT session (stable place fields) and were journey dependent in at least one block is indicated by the height of the stacked bar. Most place fields (64%) maintained consistent journey coding (the blue portion of the stacked bar) despite the overall reduction in stable place fields compared to STD sessions. D, The stacked bar shows the proportion of journey-dependent place fields recorded in the second ALT block that had a place field of any type in the block. Few JD place fields (6%) appeared for the first time in the second block of ALT1. E, Firing rate maps show the activity distribution of four CA1 cells during the first ten correct and behaviorally well structured ALT trials. The bottom panel shows the activity of cell 4 during error trials.
Figure 8.
Figure 8.
CA1 place fields remapped between ALT1 and ALT2 but journey coding remain strong. A, Most CA1 cells (∼70%) had stable place fields on the same arm in repeated STD or SW sessions, but only 47% of the cells with place fields in ALT1 had place fields on the same arm in ALT2 (Bahar et al., 2011). B, Unstable and stable place fields were often recorded together by the same tetrode. C, The proportion of journey-dependent place fields recorded during ALT1 was similar in cells with stable and unstable place fields. D, The firing rate maps show the activity of three cells recorded by the same tetrode across ALT1 and ALT2 sessions. Cells 1 and 2 fired on the waiting platform, were silent during ALT1, but had journey-dependent (JD) place fields in ALT2. Cell 3 had stable JD activity in both sessions. E, Cells 4 and 5, recorded simultaneously from another tetrode, showed stable JD activity across ALT1 and ALT2. F, The number of place fields that were identified in both repeated sessions (stable place fields) and were journey-dependent in at least one session was higher across repeated STD (62) than ALT (30) sessions, indicated by the height of the stacked bars (STD1 versus STD2 (left) and ALT1 versus ALT 2 (right). The smaller height of the ALT bars reflects the decline of place field stability in this task rather than a reduction in the number of place fields per se. The fate of these stable place fields with respect to journey coding is shown by the colors (as described in caption 5D). Similar proportions of stable JD place fields were recorded across repeated STD and ALT sessions (∼50%) even though the absolute number of stable place fields was greater in the STD. JI, Journey independent. G, The stacked columns show the proportion of journey-dependent place fields recorded in the second session that had a place field of any type in the first session. The gray stack in the left column shows the proportion of cells with journey-dependent place fields in STD2 that also had place fields in STD1; the black stack shows the proportion of cells that had no place field in STD1. These proportions were significantly different across repeated ALT sessions (right column), when many new place fields emerged (Bahar et al., 2011). Moreover, new JD codes were more common in newly emerged place fields in ALT 2 (25/48, 52%) than in the place fields that were stable across ALT1 and ALT2 (4/19, 21%) (χ2(1) = 5.3, p < 0.03).
Figure 9.
Figure 9.
Journey coding categories remapped across tasks. The histograms show the distributions of journey-independent, prospective, and retrospective place fields in the new tasks (SW or ALT) in all cells with a place field in both the STD and the new task (independent of maze arm). The actual distributions based on the STD session (Real data, black bars) were compared to the distributions expected by independent coding across tasks (Expected, gray bars). The category labels on the x-axes describe, from left to right, journey coding in the STD and new tasks, respectively. For example, “pp” includes cells that had prospective activity in both STD1 and the new task; “ir” includes cells that had journey-independent activity during the STD task and retrospective activity during the new task, etc.; p, prospective, r, retrospective; and i, journey independent. The actual and expected distributions were statistically indistinguishable. A, STD and SW sessions, CA1: χ2(7) = 3.2, p = 0.86; B, CA3: χ2(7) = 4.8, p = 0.67; C, STD and ALT sessions, CA1: χ2(5) = 0.6, p = 0.99; D, CA3: sign test = 3, p = 0.73 (too few samples for χ2).

References

    1. Ainge JA, Tamosiunaite M, Woergoetter F, Dudchenko PA. Hippocampal CA1 place cells encode intended destination on a maze with multiple choice points. J Neurosci. 2007;27:9769–9779. - PMC - PubMed
    1. Bahar AS, Shirvalkar PR, Shapiro ML. Memory guided learning: CA1 and CA3 neuronal ensembles differentially encode the commonalities and differences between situations. J Neurosci. 2011;31:12270–12281. - PMC - PubMed
    1. Bower MR, Euston DR, McNaughton BL. Sequential-context-dependent hippocampal activity is not necessary to learn sequences with repeated elements. J Neurosci. 2005;25:1313–1323. - PMC - PubMed
    1. Brun VH, Otnass MK, Molden S, Steffenach HA, Witter MP, Moser MB, Moser EI. Place cells and place recognition maintained by direct entorhinal-hippocampal circuitry. Science. 2002;296:2243–2246. - PubMed
    1. Cenquizca LA, Swanson LW. Spatial organization of direct hippocampal field CA1 axonal projections to the rest of the cerebral cortex. Brain Res Rev. 2007;56:1–26. - PMC - PubMed

Publication types