. 2012 May;19(4):343-51.
doi: 10.1111/j.1549-8719.2012.00168.x.

3D reconstruction of the glycocalyx structure in mammalian capillaries using electron tomography

Affiliations

3D reconstruction of the glycocalyx structure in mammalian capillaries using electron tomography

Kenton P Arkill et al. Microcirculation. 2012 May.

Abstract

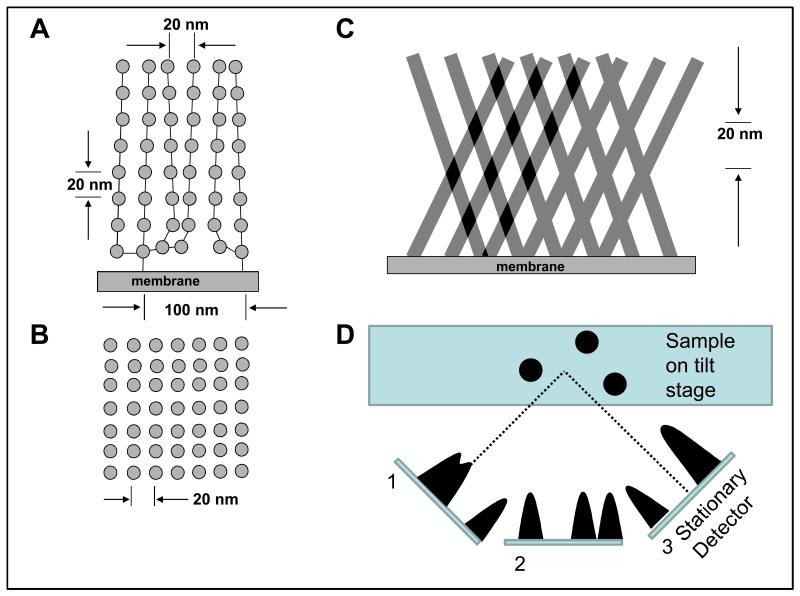
Objective: Visualising the molecular strands making up the glycocalyx in the lumen of small blood vessels has proved to be difficult using conventional transmission electron microscopy techniques. Images obtained from tissue stained in a variety of ways have revealed a regularity in the organisation of the proteoglycan components of the glycocalyx layer (fundamental spacing about 20 nm), but require a large sample number. Attempts to visualise the glycocalyx face-on (i.e. in a direction perpendicular to the endothelial cell layer in the lumen and directly applicable for permeability modelling) has had limited success (e.g. freeze fracture). A new approach is therefore needed.

Methods: Here we demonstrate the effectiveness of using the relatively novel electron microscopy technique of 3D electron tomography on two differently stained glycocalyx preparations. A tannic acid staining method and a novel staining technique using Lanthanum Dysprosium Glycosamino Glycan adhesion (the LaDy GAGa method).

Results: 3D electron tomography reveals details of the architecture of the glycocalyx just above the endothelial cell layer. The LaDy GAGa method visually appears to show more complete coverage and more depth than the Tannic Acid staining method.

Conclusion: The tomographic reconstructions show a potentially significant improvement in determining glycocalyx structure over standard transmission electron microscopy.


Figures

Figure 1
Figure 1
Previous interpretation of the glycocalyx staining patterns from the side (A) and plan view from the lumen (B). This demonstates a 20nm tetragonal lattice with membrane binding at 100nm intervals (23). (C) An example of possible misinterpretation of the appearances of projected sections, where successive tilted layers of ‘smooth’ fibres could cross through the depth of the section to give apparent 2D periodicities (Moiré patterns). (D) Explanation of electron tomography. The electron beam passes through the sample. The sample is tilted so that images are taken at different angles (1, 2, 3) without moving the detector. The images at known viewing angles can then be reconstructed, for example using back-projection, to produce a 3D image of the sample (see Supplementary Material for movie).
Figure 2
Figure 2
Analysis of a tomographic reconstruction of the glycocalyx obtained using the Rostgaard staining technique in a rat peritubular capillary. (A) is the output from the reconstruction (Scale Bar = 100 nm). (B) is the view from the lumen to the area of the black line in (A). The tomogram has been stretched to the appropriate dimensions to account for shrinkage (Scale Bar = 100 nm). (C) is the autocorrelation of the boxed area in (B) and (D) is the same autocorrelation, but with the dashed lines representing common spacing distances overlaid. (Scale bars in (C) and (D) are 50 nm ).
Figure 3
Figure 3
Figure showing that the vertical spacing observed within the glycocalyx is not a Moiré artefact. (A) shows a thin slice (about 1 nm thick; a single fibre layer) of glycocalyx from the Rostgaard staining technique (20) tomogram, from dwarf rabbit choroid capillary, with three areas selected and boxed. (B) is an autocorrelation from the right hand area in (A). (C) shows periodicities in the average autocorrelation functions from all three areas in (A) both parallel to and perpendicular to the endothelial cell membrane. There are clear ‘vertical’ perpendicular spacings apparent in the autocorrelation even though the slice is only one fibre thick. (Scale bar is 100 nm.)
Figure 4
Figure 4
Analysis of a tomographic reconstruction of the glycocalyx obtained using the LaDy GAGa staining technique on mouse psoas capillary. (A) is the output from the reconstruction (Scale Bar = 100 nm). (B) is the view from the lumen in (A). The tomogram has been stretched to the appropriate dimensions to account for shrinkage (Scale Bar = 50 nm). (C,D) is the autocorrelation of the boxed area with dashed lines highlighting the lattices present in the autocorrelationin (D). (Scale Bar =50nm).
Figure 5
Figure 5
Stereo pair of the 3D density from a section of the glycocalyx from rat peritubular capillary using the Rostgaard technique. The reconstruction has had the background subtracted, has been converted to a mesh and is shown at two slightly different viewing angles. The shapes of individual fibres are starting to be revealed. (Scale bar = 100nm).

References

    1. Arkill KP, Knupp C, Michel CC, Neal CR, Qvortrup K, Rostgaard J, Squire JM. Similar endothelial glycocalyx structures in microvessels from a range of mammalian tissues: Evidence for a common filtering mechanism? Biophysical Journal. 2011;101:1046–1056. - PMC - PubMed
    1. Crowther RA, Derosier DJ, Klug A. Reconstruction of 3 dimensional structure from projections and its application to electron microscopy. Proceedings of the Royal Society of London. Series A: Mathematical and Physical Sciences. 1970;317:319–340.
    1. Curry FE, Adamson RH. Endothelial glycocalyx: Permeability barrier and mechanosensor. Annals of Biomedical Engineering. 2011 - PMC - PubMed
    1. Florian JA, Kosky JR, Ainslie K, Pang ZY, Dull RO, Tarbell JM. Heparan sulfate proteoglycan is a mechanosensor on endothelial cells. Circulation Research. 2003;93:E136–E142. - PubMed
    1. Fujikawa S. Tannic-acid improves the visualization of the human-erythrocyte membrane skeleton by freeze-etching. Journal of Ultrastructure Research. 1983;84:289–298. - PubMed

Publication types