. 2012 Feb 17;148(4):664-78.
doi: 10.1016/j.cell.2011.12.029. Epub 2012 Feb 9.

RYBP-PRC1 complexes mediate H2A ubiquitylation at polycomb target sites independently of PRC2 and H3K27me3

Affiliations

RYBP-PRC1 complexes mediate H2A ubiquitylation at polycomb target sites independently of PRC2 and H3K27me3

Lígia Tavares et al. Cell. .

Erratum in

  • Cell. 2012 Jun 22;149(7):1647-8

Abstract

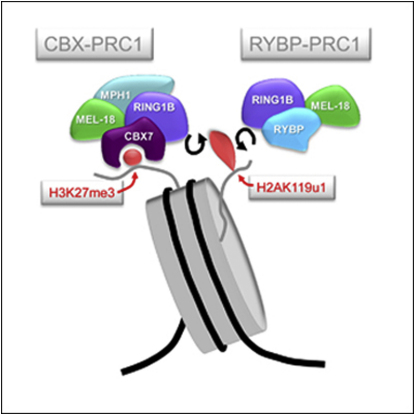
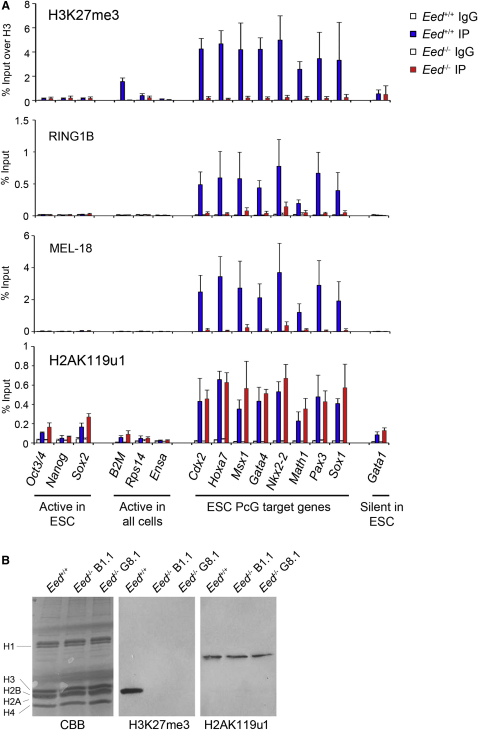
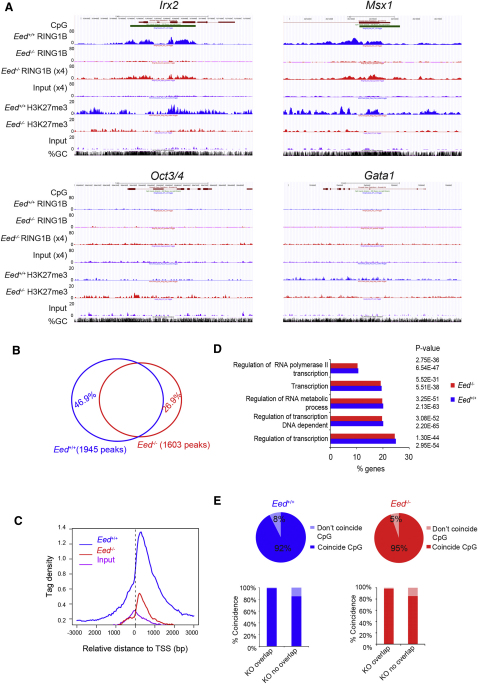
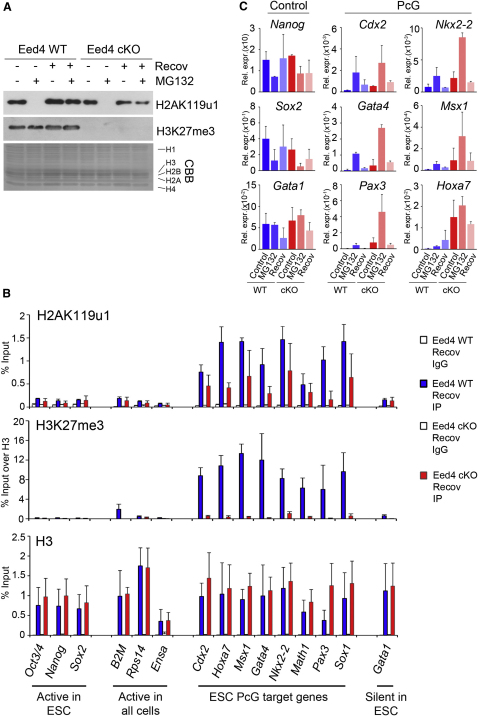
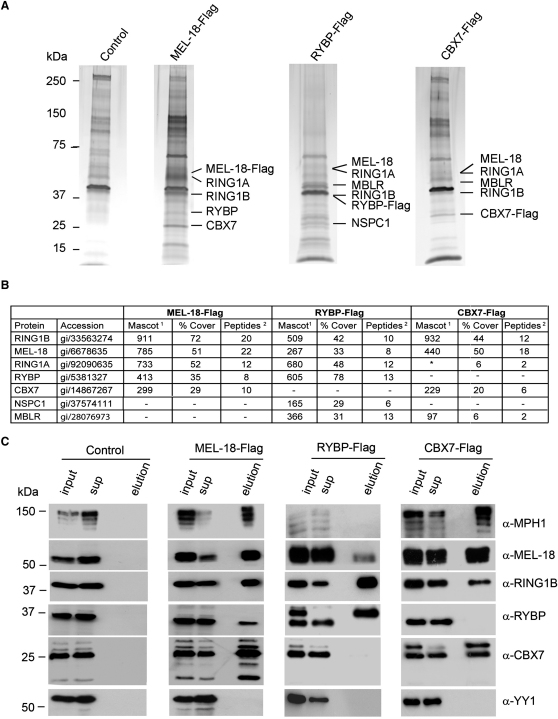
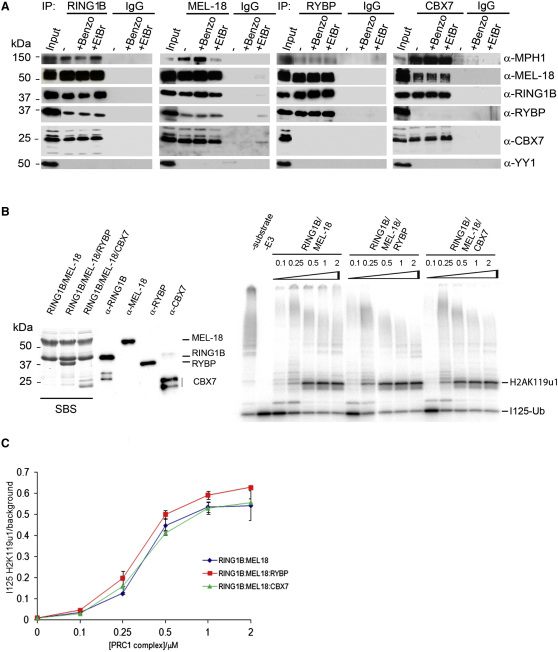
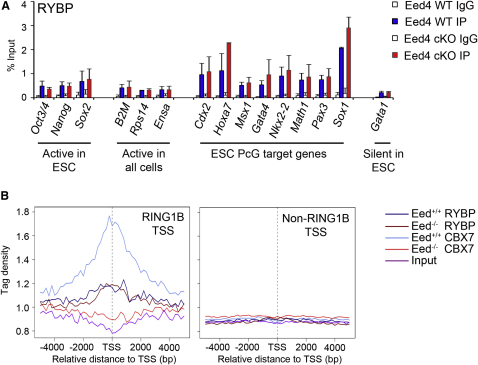
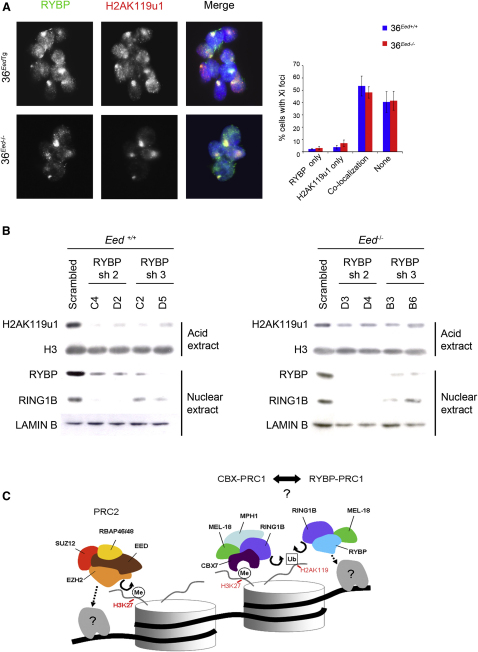
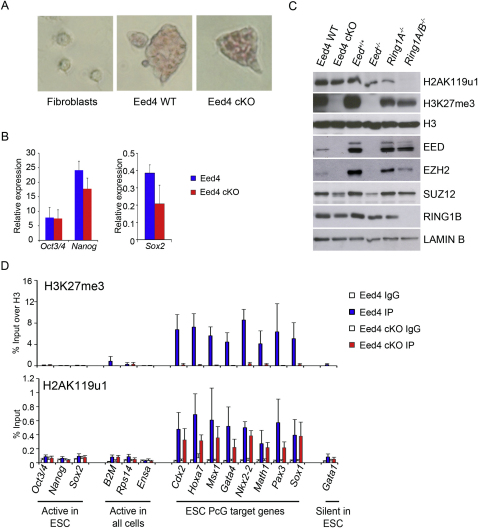
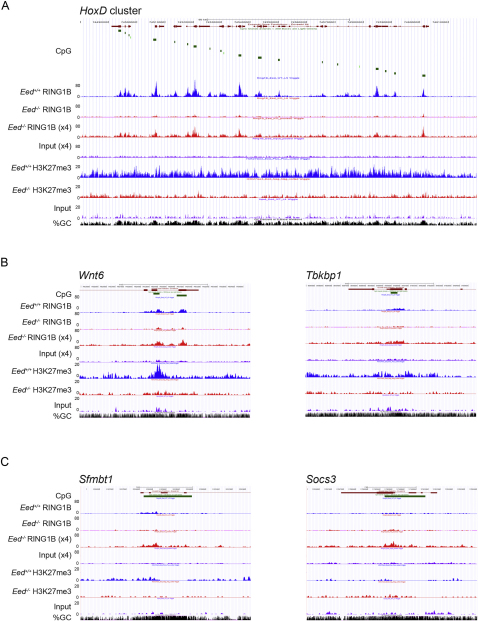
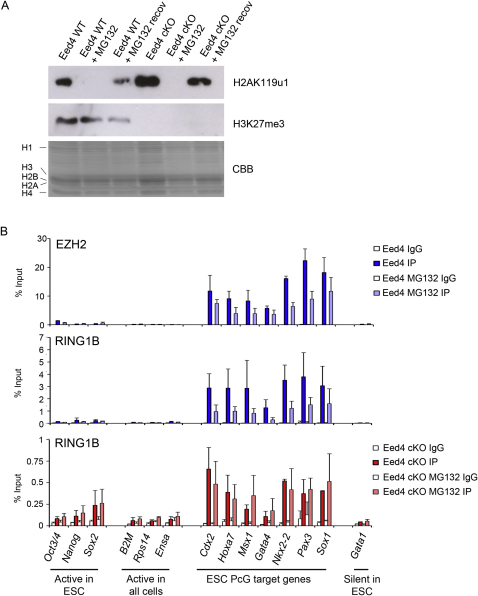
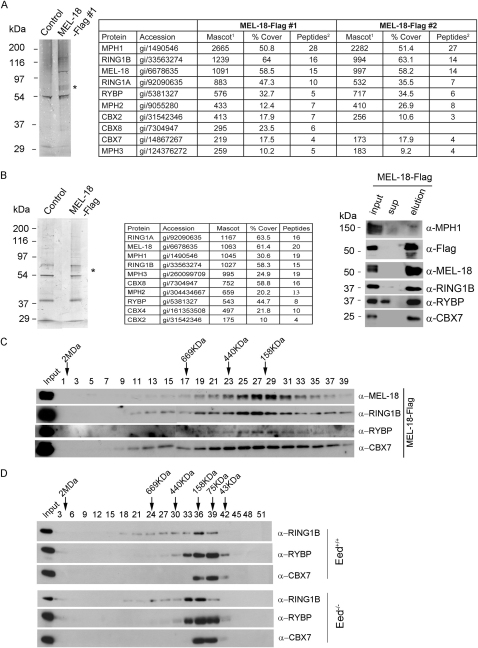
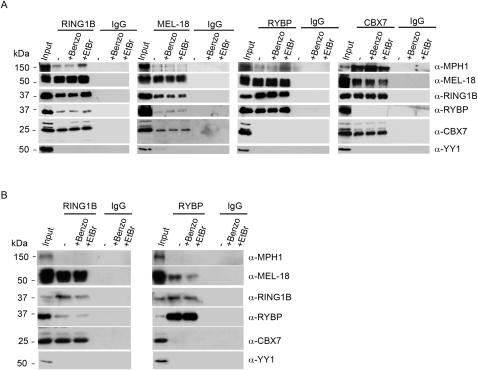
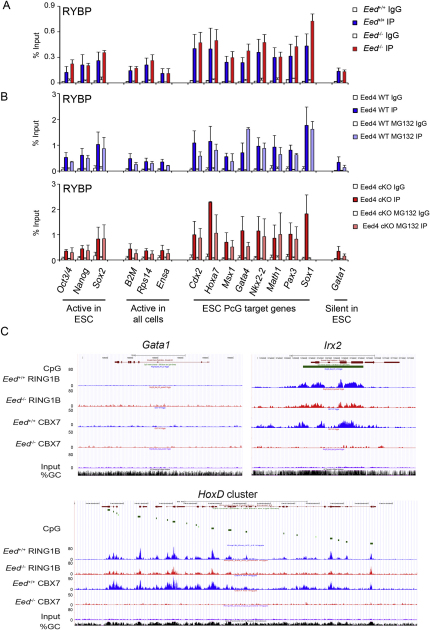
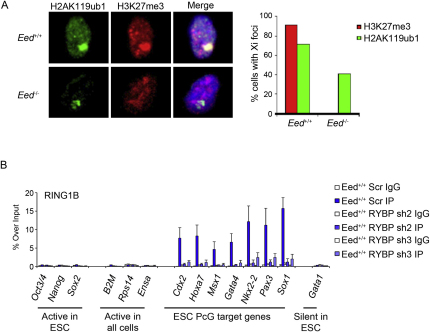
Polycomb-repressive complex 1 (PRC1) has a central role in the regulation of heritable gene silencing during differentiation and development. PRC1 recruitment is generally attributed to interaction of the chromodomain of the core protein Polycomb with trimethyl histone H3K27 (H3K27me3), catalyzed by a second complex, PRC2. Unexpectedly we find that RING1B, the catalytic subunit of PRC1, and associated monoubiquitylation of histone H2A are targeted to closely overlapping sites in wild-type and PRC2-deficient mouse embryonic stem cells (mESCs), demonstrating an H3K27me3-independent pathway for recruitment of PRC1 activity. We show that this pathway is mediated by RYBP-PRC1, a complex comprising catalytic subunits of PRC1 and the protein RYBP. RYBP-PRC1 is recruited to target loci in mESCs and is also involved in Xist RNA-mediated silencing, the latter suggesting a wider role in Polycomb silencing. We discuss the implications of these findings for understanding recruitment and function of Polycomb repressors.


Figures

None
Graphical abstract
Figure 1
Figure 1
Retention of H2AK119u1 at PcG Target Loci in Eed−/− mESCs (A) ChIP analysis of H3K27me3, RING1B, MEL-18, and H2AK119u1 in wild-type (Eed+/+) and Eed−/− mESCs. Bars show average + SD, n = 3. (B) Western blot analysis of histone extracts showing absence of H3K27me3 and retention of H2AK119u1 in two independent Eed−/− mESC cell lines, B1.1 and G8.1. CBB (Coomassie brilliant blue). See also Figure S1.
Figure 2
Figure 2
ChIP-Seq Demonstrates RING1B Occupancy at PcG Target Loci in Eed+/+ and Eed−/− mESCs (A) Example screen shots for Eed+/+ IP (blue) and Eed−/− IP (red) and input (lilac). Irx2 and Msx1 are PcG targets. Oct3/4 and Gata1 are non-PcG targets. (B) Venn diagram indicating overlap of RING1B peaks (genes) in Eed+/+and Eed−/− cells. (C) Tag density in relation to TSS of 20 million reads randomly subsampled. (D) Comparison showing similarity in gene ontology distribution for peaks in Eed+/+ and Eed−/− mESCs. (E) Co-incidence of peaks with CpG islands for Eed+/+ and Eed−/− mESCs (above) and the proportion of peaks coinciding with CpG islands in overlapping and nonoverlapping subgroups defined in (B). See also Figure S2.
Figure 3
Figure 3
H2AK119u1 Is Re-established following Depletion in Eed4 WT and Eed4 cKO mESCs (A) Western blot for H2AK119u1 and H3K27me3 in histone extracts. CBB: Coomassie brilliant blue. H2AK119u1 is completely depleted after 6 hr with 10 μM MG132 and is then restored when cells are left to recover (recov) for 3 days after inhibitor removal, irrespective of presence of H3K27me3. (B) ChIP for H2AK119u1 and H3K27me3 in Eed4 WT and Eed4 cKO cells. H3 is shown as a control. Bars show average + SD, n = 3. (C) Expression analysis (Rel. expr.) of selected loci. For RT-PCR analysis, values were normalized against the average of three housekeeping genes, Hmbs, Gapdh, and Idh1. Bars show average + SD, n = 3. See also Figure S3.
Figure 4
Figure 4
Proteomic Analysis of MEL-18, RYBP, and CBX7 Complexes in mESCs (A) Silver-stained SDS polyacrylamide gel of control, MEL-18-Flag, RYBP-Flag, and CBX7-Flag purifications. PRC1 subunits identified by mass spectrometry of excised bands are indicated. (B) Table showing the PRC1 core subunits copurifying with MEL-18-Flag, RYBP-Flag, and CBX7-Flag, as identified by mass spectrometry analysis. 1Mascot score for specified proteins, 2number of unique peptides identified. The two peptides matched to RING1A are also present in RING1B. (C) MEL-18-Flag, RYBP-Flag, and CBX7-Flag purifications analyzed by western blot with the indicated antibodies. See also Figure S4.
Figure 5
Figure 5
MEL-18 Interacts with RYBP and CBX7 in Mutually Exclusive Catalytically Active Complexes (A) CoIP of endogenous RING1B, MEL-18, RYBP, and CBX7 from Eed4 WT mESC nuclear extracts, analyzed by western blot with the indicated antibodies and the appropriate IgG control. Benzonase (Benzo) and ethidium bromide (EtBr) were added where indicated. 10% input and 15% of RING1B, MEL-18, RYBP, CBX7, and the appropriate control CoIP are shown. (B) Left panel: RING1B/MEL-18, RING1B/MEL-18/RYBP, and RING1B/MEL-18/CBX7 protein complexes analyzed by western blot using antibodies as indicated, or by Simply Blue Safe staining (SBS). Right panel: Ubiquitylation assays performed using indicated concentrations of RING1B/MEL-18 (lanes 3–7), RING1B/MEL-18/RYBP (lanes 8–12), and RING1B/MEL-18/CBX7 (lanes 13–17) complexes. Control assays are with substrate omitted or E3 ligase omitted. I125-ubiquitin-labeled products are shown. (C) Quantitation of H2AK119u1 from three independent assays as shown in (B). See also Figure S5.
Figure 6
Figure 6
RYBP-PRC1 Is Recruited to PcG Target Genes Independently of PRC2 (A) ChIP analysis of RYBP in Eed4 WT and Eed4 cKO mESCs, showing average values + SD (n = 3). (B) Tag density across the TSS of 20 million reads randomly subsampled. RYBP, CBX7, and input tags were clustered in two different subgroups, RING1B TSS and non-RING1B TSS (see Figure 2B). Data are shown for both Eed+/+ and Eed−/− mESCs. See also Figure S6.
Figure 7
Figure 7
RYBP-PRC1 Is Recruited to Xist RNA Territories Independently of H3K27me3 and Is Required for H2AK119 Ubiquitylation in Eed+/+ and Eed−/− mESCs (A) Immunofluorescence analysis of RYBP (green) and H2AK119u1 (red) in 36EedTg and 36Eed−/− mESCs induced to express transgenic Xist RNA. DNA was counterstained with DAPI (blue). Graphs illustrate the proportion of cells in which H2AK119u1 foci and RYBP foci colocalize, based on scoring 100 cells on each of three separate slides. (B) Stable cell lines were established following transduction of Eed+/+ and Eed−/− mESCs with scrambled or either of two independent RYBP shRNAs (sh2 and sh3). Acid extracted histones (H2AK119u1 and H3) or nuclear extracts (RYBP, RING1B, and LAMIN B), were prepared and analyzed by western blot. (C) Model as discussed in text. Key: DNA (black line); nucleosomes with single N terminus of H3 and C terminus of H2A (cylinders); H3K27 trimethylation (Me); H2AK119u1 (Ub); recruitment factors (gray shape with ?). See also Figure S7.
Figure S1
Figure S1
H2AK119u1 Is Retained following Conditional Deletion of Eed in mESCs, Related to Figure 1 (A) Alkaline phosphatase staining showing that Eed4 wild-type (WT) and Eed4 cKO cells, 15 days after treatment with 1 μg/ml doxycycline, maintain mESC characteristics. Fibroblasts were used as negative control. (B) Expression analysis of pluripotency genes Oct3/4, Nanog, and Sox2 in Eed4 WT and Eed4 cKO 15 days after treatment with 1 μg/ml doxycycline. Expression was normalized against the average of three housekeeping genes, Hmbs, Gapdh, and Idh1. Bars show average + SD, n = 3. (C) Western blot analysis of histone extracts (H2AK119u1, H3K27me3, H3) and nuclear extracts (EED, EZH2, SUZ12, RING1B, and LAMIN B) in wild-type and mutant mESC lines as indicated. (D) ChIP analysis at PcG target and control genes for H3K27me3 and H2AK119ub1 in Eed4 WT and Eed4 cKO mESCs. Bars show average + SD, n = 3.
Figure S2
Figure S2
RING1B Occupancy Is Similar in Eed+/+ and Eed−/− mESCs, Related to Figure 2 Example screen shots illustrate (A) HoxD; (B) Wnt6 and Tbkbp1 loci, both of which were recorded as peaks in Eed+/+ but not Eed−/− datasets; and (C) Sfmbt1 and Socs3 loci, both of which were recorded as peaks in Eed−/− but not Eed+/+datasets. Panels show gene structure, CpG islands, and % GC tracks in addition to distribution of RING1B ChIP-seq reads in Eed+/+ IP (blue) and Eed−/− IP (red) and input (lilac).
Figure S3
Figure S3
H2AK119u1 Levels Are Re-established 24 hr after Removal of MG132 Inhibitor from the Culture Medium, Related to Figure 3 (A) Western blot of histone extracts shows H2AK119u1 levels before MG132 treatment, during treatment (+MG132) and 24 hr after removal of MG132 (+MG132 recov), in both Eed4 WT and Eed4 cKO ESCs. (B) ChIP analysis of EZH2 in Eed4 WT and RING1B in Eed4 WT and Eed4 cKO mESCs treated with 10 μM MG132 for 6 hr.
Figure S4
Figure S4
Related to Figure 4 (A) Purification of MEL-18 complexes from ESCs. Left: Colloidial Coomassie-stained SDS-polyacrylamide gel of a MEL-18-Flag purification and control purification from PGK12.1 ESCs. Asterisk indicates bands that represent the different phosphorylated forms of MEL-18 (Elderkin et al., 2007). Right: Table showing core PRC1 subunits copurifying with MEL-18-Flag, as identified by LC-MS/MS analysis in two entirely independent experiments. 1Mascot score for specified proteins, 2number of unique peptides identified. (B) Purification of MEL-18 complexes from NSCs. Left: Colloidial Coomassie-stained SDS-polyacrylamide gel of a MEL-18-Flag purification and control purification from NSCs. Asterisk indicates bands that represent MEL-18. Middle: Table showing core PRC1 subunits copurifying with MEL-18-Flag, as identified by LC-MS/MS analysis. Right: MEL-18-Flag purification analyzed by western blot with the indicated antibodies. (C) Size-exclusion analysis of mESC MEL-18 complex (25% eluted fraction) after Flag affinity purification (25% input) probed with indicated antibodies. (D) Size-exclusion analysis of nuclear extract from Eed+/+ and Eed−/− ESCs probed with the indicated antibodies.
Figure S5
Figure S5
Related to Figure 5 (A) CoIP of endogenous RING1B, MEL-18, RYBP, and CBX7 and the appropriate IgG control from Eed4 cKO ESC nuclear extracts, analyzed by western blot with the indicated antibodies. Benzonase (Benzo) and ethidium bromide (EtBr) were added where indicated. 10% input and 15% of RING1B, MEL-18, RYBP, CBX7, and the appropriate control coimmunoprecipitations are shown. (B) CoIP of endogenous RING1B, RYBP and the appropriate IgG control from FSPE cell nuclear extracts, analyzed by western blot with the indicated antibodies. Benzonase (Benzo) and ethidium bromide (EtBr) were added where indicated. 10% input and 15% of RING1B, RYBP, and the appropriate control CoIP are shown.
Figure S6
Figure S6
PRC1-RYBP Recruitment to PcG Target Genes in Eed+/+ and Eed−/− mESCs, Related to Figure 6 (A and B) ChIP analysis of RYBP in Eed+/+ compared to Eed−/− mESCs (A) and in Eed4 WT and Eed4 cKO mESCs (B) that were treated with 10 μM MG132 for 6 hr. Bars show average + SD, n = 3. (C) Example screen shots illustrate gene structure, CpG islands, and % GC tracks in addition to distribution of RING1B and CBX7 ChIP-seq reads in Eed+/+ IP (blue) and Eed−/− IP (red) and input (lilac). Control gene is the non-PcG target Gata1 (repressed). PcG targets illustrated are Irx2 and the HoxD cluster.
Figure S7
Figure S7
RYBP Is Required for RING1B Recruitment to PcG Target Genes, Related to Figure 7 (A) H2AK119u1 on the inactive X chromosome is retained but at diminished levels in Eed−/− embryos. IF analysis was carried out on cells from trypsin dissociated embryos recovered at E7.5. Examples of IF illustrate that H2AK119u1 Xi foci are retained in homozygous mutant XX embryos, albeit less strongly. Scoring data show that H2AK119u1 Xi foci are present in 41% of Eed−/− XX embryos (n = 243 cells from 4 embryos) compared to 72% in Eed+/+ XX embryos (n = 611 cells from 6 embryos). H3K27me3 Xi foci were observed only in WT embryos. Data for heterozygous embryos are not shown but closely mirror Eed+/+ embryos. (B) ChIP analysis of RING1B in wild-type (Eed+/+) mESCs transduced with scrambled (Scr) or either of two independent RYBP shRNAs (sh2 and sh3). Bars show average + SD, n = 3.

Similar articles

Cited by

References

    1. Agger K., Cloos P.A.C., Christensen J., Pasini D., Rose S., Rappsilber J., Issaeva I., Canaani E., Salcini A.E., Helin K. UTX and JMJD3 are histone H3K27 demethylases involved in HOX gene regulation and development. Nature. 2007;449:731–734. - PubMed
    1. Arrigoni R., Alam S.L., Wamstad J.A., Bardwell V.J., Sundquist W.I., Schreiber-Agus N. The Polycomb-associated protein Rybp is a ubiquitin binding protein. FEBS Lett. 2006;580:6233–6241. - PubMed
    1. Azuara V., Perry P., Sauer S., Spivakov M., Jørgensen H.F., John R.M., Gouti M., Casanova M., Warnes G., Merkenschlager M., Fisher A.G. Chromatin signatures of pluripotent cell lines. Nat. Cell Biol. 2006;8:532–538. - PubMed
    1. Bejarano F., González I., Vidal M., Busturia A. The Drosophila RYBP gene functions as a Polycomb-dependent transcriptional repressor. Mech. Dev. 2005;122:1118–1129. - PubMed
    1. Boyer L.A., Plath K., Zeitlinger J., Brambrink T., Medeiros L.A., Lee T.I., Levine S.S., Wernig M., Tajonar A., Ray M.K. Polycomb complexes repress developmental regulators in murine embryonic stem cells. Nature. 2006;441:349–353. - PubMed

Supplemental References

    1. Atsuta, T., Fujimura, S., Moriya, H., Vidal, M., Akasaka, T., and Koseki, H. (2001). Production of monoclonal antibodies against mammalian Ring1B proteins. Hybridoma 20, 43–46. - PubMed
    1. Conti, L., Pollard, S.M., Gorba, T., Reitano, E., Toselli, M., Biella, G., Sun, Y., Sanzone, S., Ying, Q.L., Cattaneo, E., and Smith, A. (2005). Niche-independent symmetrical self-renewal of a mammalian tissue stem cell. PLoS Biol. 3, e283. - PMC - PubMed
    1. de Napoles, M., Mermoud, J.E., Wakao, R., Tang, Y.A., Endoh, M., Appanah, R., Nesterova, T.B., Silva, J., Otte, A.P., Vidal, M., et al. (2004). Polycomb group proteins Ring1A/B link ubiquitylation of histone H2A to heritable gene silencing and X inactivation. Dev. Cell 7, 663–676. - PubMed
    1. Dennis, G., Jr., Sherman, B.T., Hosack, D.A., Yang, J., Gao, W., Lane, H.C., and Lempicki, R.A. (2003). DAVID: Database for Annotation, Visualization, and Integrated Discovery. Genome Biol. 4, 3. - PubMed
    1. Huang, W., Sherman, B.T., and Lempicki, R.A. (2009). Systematic and integrative analysis of large gene lists using DAVID bioinformatics resources. Nat. Protoc. 4, 44–57. - PubMed

Publication types

Associated data