. 2012 Feb 9;73(3):595-607.
doi: 10.1016/j.neuron.2011.12.025.

Rostrolateral prefrontal cortex and individual differences in uncertainty-driven exploration

Affiliations

Rostrolateral prefrontal cortex and individual differences in uncertainty-driven exploration

David Badre et al. Neuron. .

Abstract

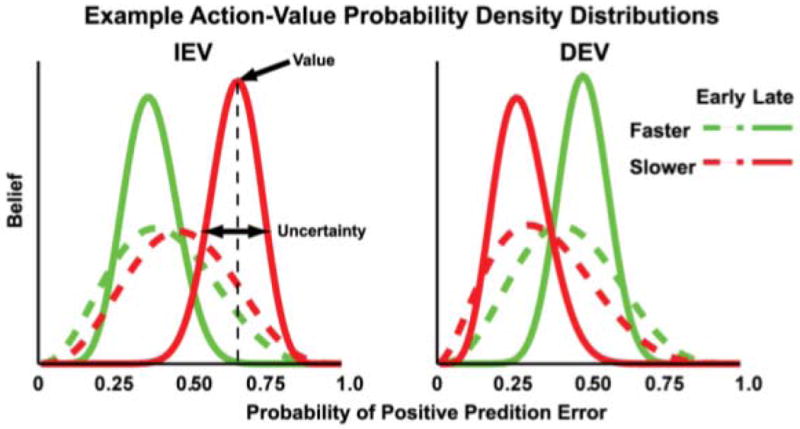
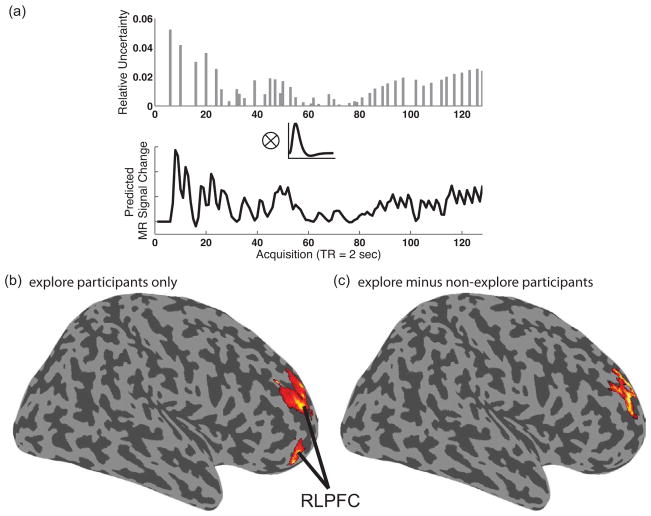
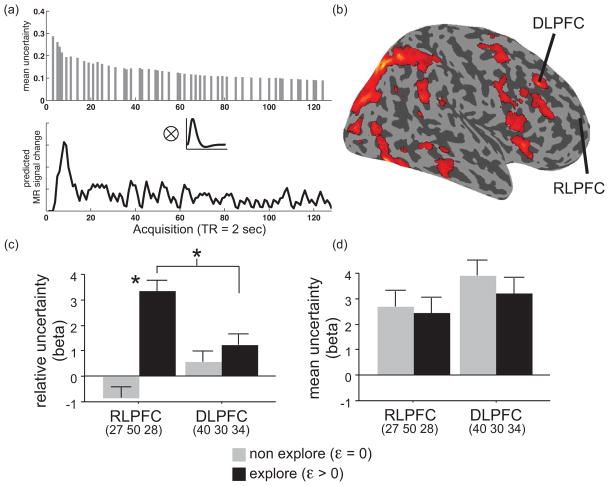
How do individuals decide to act based on a rewarding status quo versus an unexplored choice that might yield a better outcome? Recent evidence suggests that individuals may strategically explore as a function of the relative uncertainty about the expected value of options. However, the neural mechanisms supporting uncertainty-driven exploration remain underspecified. The present fMRI study scanned a reinforcement learning task in which participants stop a rotating clock hand in order to win points. Reward schedules were such that expected value could increase, decrease, or remain constant with respect to time. We fit several mathematical models to subject behavior to generate trial-by-trial estimates of exploration as a function of relative uncertainty. These estimates were used to analyze our fMRI data. Results indicate that rostrolateral prefrontal cortex tracks trial-by-trial changes in relative uncertainty, and this pattern distinguished individuals who rely on relative uncertainty for their exploratory decisions versus those who do not.


Figures

Figure 1
Figure 1
Behavioral task with plots of reward function conditions. (a) On each trial, participants stopped a rotating clock hand to win points. (b) The probability of reward as a function of RT for each expected value condition: increasing (IEV), decreasing (DEV), constant (CEV), and constant–reversed (CEVR). (c) The magnitude of reward as a function of RT across EV conditions. (d) The expected value as a function of RT for condition.
Figure 2
Figure 2
Illustration of changes in Beta distributions over the course of learning across different task conditions. The x-axis plots the probability that a particular action will yield a positive reward prediction error (RPE). Each curve plots the level of belief (y-axis) that a participant has about each probability for a given course of action, which in this task are operationalized as responding faster (green curves) or slower (red curves). The peak of each curve represents the subject’s strongest belief about the value of a particular option. Exploitative responses move in the direction of the highest perceived value. Hence, under IEV conditions (left plot) slower responses are more likely to yield a positive RPE, whereas in DEV conditions (right plot) faster responses have higher value. The standard deviation of the distribution reflects the participant’s uncertainty regarding the value of that option. Thus, early in learning (dashed line) the width is larger (and uncertainty greater) than later in learning (solid line). The difference in the standard deviations of these fast and slow distributions at any given trial is relative uncertainty.
Figure 3
Figure 3
Plots of behavioral results and model fits to individual participant behavior. (a) Average RT across participants demonstrates that incremental adjustments in RT were consistent with learning. (b) Average of individual subject model fits captured incremental adjustments in RT across learning conditions. (c) A plot from one representative participant illustrates that changes in the Explore term (blue) partially captures trial-to-trial swings in RT (green). (d) Correlation between RT swings and relative uncertainty among explorers (left) and non-explorers. All trials in all participants are plotted in aggregate with color distinguishing individuals. The correlation between RT swings and relative uncertainty was significantly different from zero in explorers (mean r=0.36, p < 0.0001), but not in non-explorers (mean r = −0.02, p>0.5).
Figure 4
Figure 4
Whole brain analysis of trial-to-trial changes in relative uncertainty. (a) Example individual subject relative uncertainty regressor from one run of one participant. Convolution of parametric changes in relative uncertainty (|σslow(t) − σfast(t)|) on each trial (top plot) with a canonical hemodynamic response function (middle plot) produced individual participant relative uncertainty regressors (bottom plot). (b) The effect of relative uncertainty, controlling for mean uncertainty and restricted to explore participants (ε > 0), revealed activation in dorsal and ventral RLPFC regions (rendered at p < .05 FWE corrected [cluster level]). (c) Contrast of relative uncertainty effect, controlling for mean uncertainty, in explore (ε > 0) versus non-explore (ε = 0) participants revealed a group difference in RLPFC (rendered at p < .05 FWE corrected [cluster level]).
Figure 5
Figure 5
Whole brain and ROI analysis of mean and relative uncertainty. (a) Example individual subject mean uncertainty regressor from one run of one participant. Convolution of parametric changes in mean uncertainty ([σslow(t)+σfast(t)]/2) on each trial (top plot) with a canonical hemodynamic response function (middle plot) produced individual participant mean uncertainty regressors (bottom plot). (b) Mean uncertainty in the whole group, controlling for relative uncertainty, yielded activation in a large neocortical network including right DLPFC (rendered at p < .05 FWE corrected [cluster level]). (c) ROI analysis based on extracted beta estimates of relative uncertainty confirmed a group difference in relative uncertainty within RLPFC and showed a greater effect of relative uncertainty in RLPFC than DLPFC in explorers (* p < .05). (d) ROI analysis based on extracted beta estimates of mean uncertainty found no differences in mean uncertainty between groups.

References

    1. Aston-Jones G, Cohen JD. An integrative theory of locus coeruleus-norepinephrine function: adaptive gain and optimal performance. Annu Rev Neurosci. 2005;28:403–450. - PubMed
    1. Badre D. Cognitive control, hierarchy, and the rostro-caudal organization of the frontal lobes. Trends Cogn Sci. 2008;12:193–200. - PubMed
    1. Badre D, Frank MJ. Mechanisms of hierarchical reinforcement learning in cortico-striatal circuits 2: Evidence from fMRI. Cerebral Cortex (In Press) - PMC - PubMed
    1. Boorman ED, Behrens TE, Woolrich MW, Rushworth MF. How green is the grass on the other side? Frontopolar cortex and the evidence in favor of alternative courses of action. Neuron. 2009;62:733–743. - PubMed
    1. Braver TS, Bongiolatti SR. The role of frontopolar cortex in subgoal processing during working memory. Neuroimage. 2002;15:523–536. - PubMed

Publication types

MeSH terms

LinkOut - more resources