. 2012 Feb 10;10(1):9.
doi: 10.1186/1477-5956-10-9.

Spatiotemporal expression profiling of proteins in rat sciatic nerve regeneration using reverse phase protein arrays

Affiliations

Spatiotemporal expression profiling of proteins in rat sciatic nerve regeneration using reverse phase protein arrays

David J Bryan et al. Proteome Sci. .

Abstract

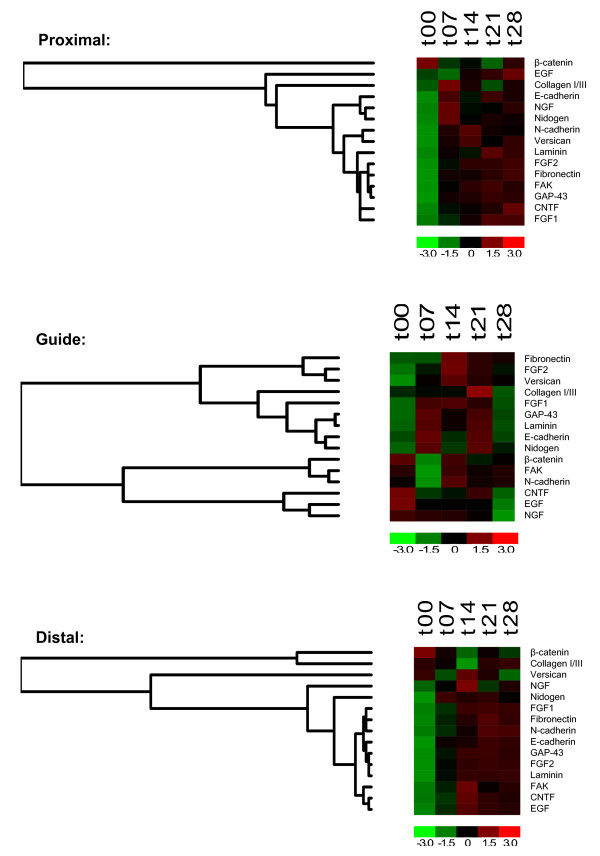
Background: Protein expression profiles throughout 28 days of peripheral nerve regeneration were characterized using an established rat sciatic nerve transection injury model. Reverse phase protein microarrays were used to identify the spatial and temporal expression profile of multiple proteins implicated in peripheral nerve regeneration including growth factors, extracellular matrix proteins, and proteins involved in adhesion and migration. This high-throughput approach enabled the simultaneous analysis of 3,360 samples on a nitrocellulose-coated slide.

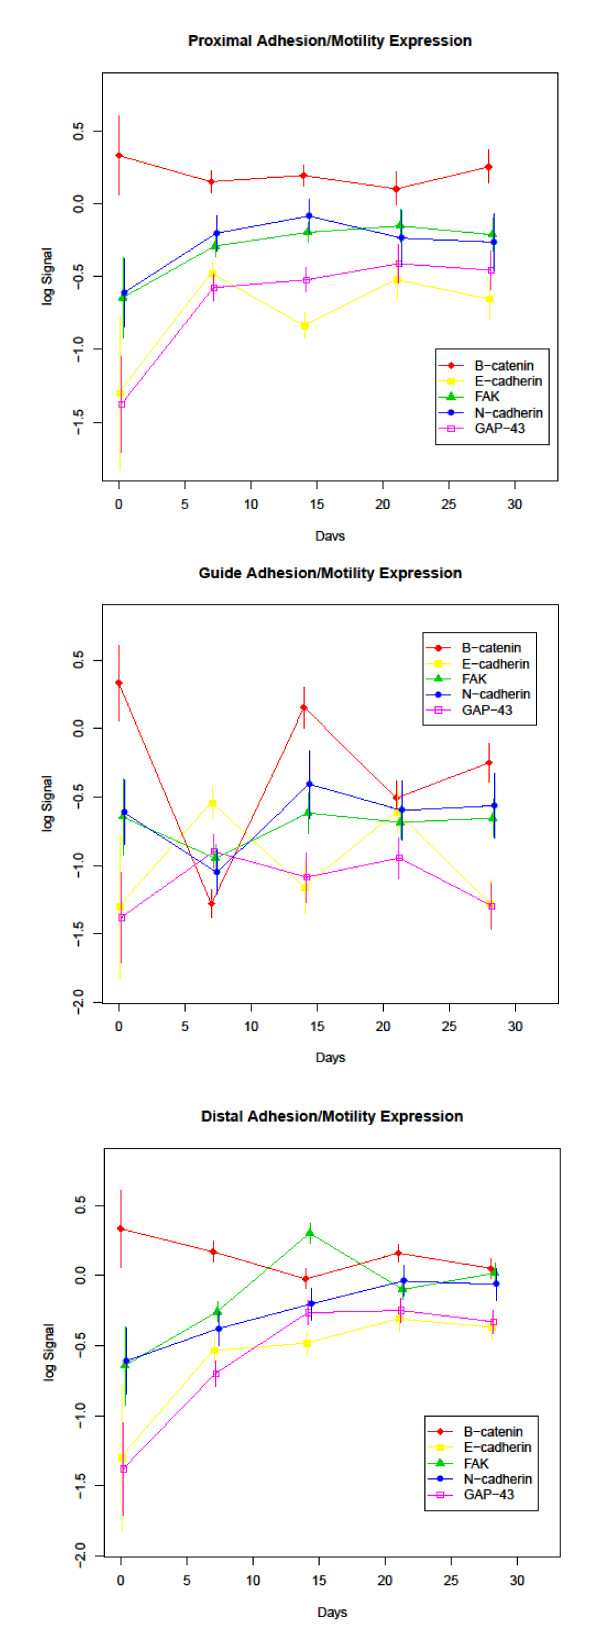
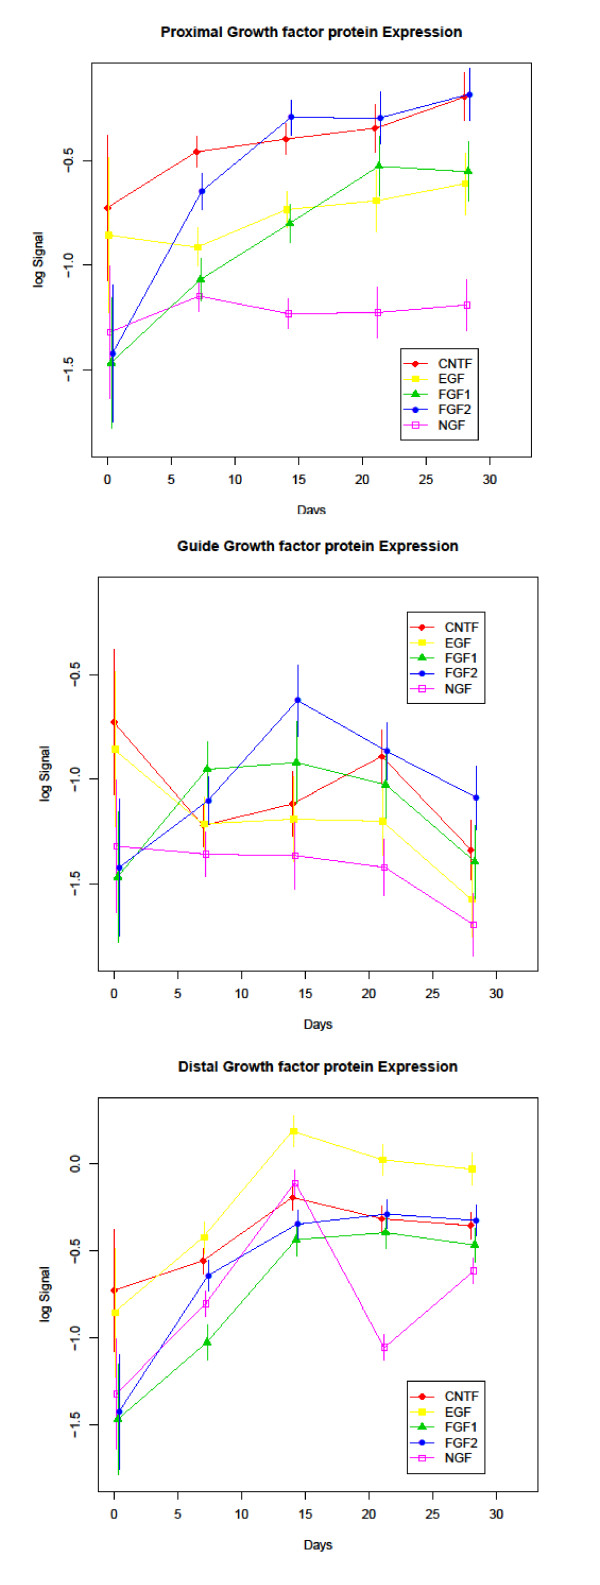
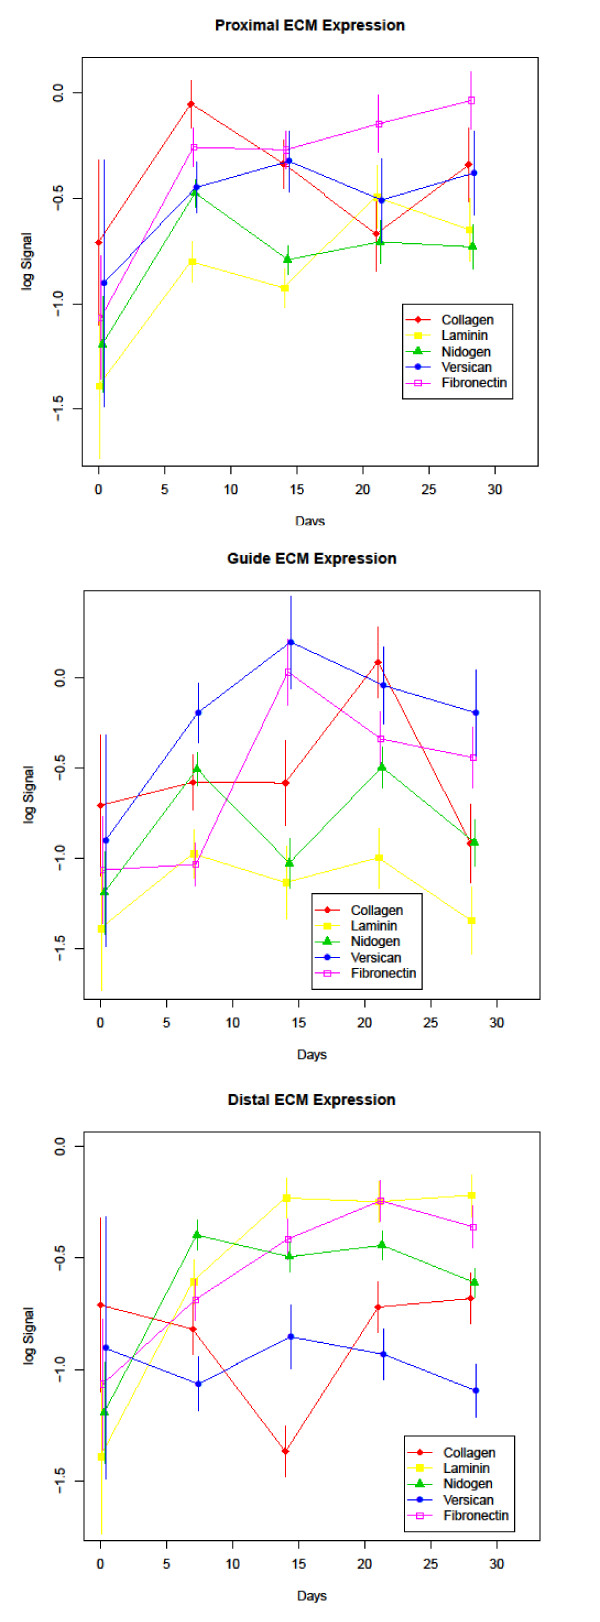
Results: The extracellular matrix proteins collagen I and III, laminin gamma-1, fibronectin, nidogen and versican displayed an early increase in protein levels in the guide and proximal sections of the regenerating nerve with levels at or above the baseline expression of intact nerve by the end of the 28 day experimental course. The 28 day protein levels were also at or above baseline in the distal segment however an early increase was only noted for laminin, nidogen, and fibronectin. While the level of epidermal growth factor, ciliary neurotrophic factor and fibroblast growth factor-1 and -2 increased throughout the experimental course in the proximal and distal segments, nerve growth factor only increased in the distal segment and fibroblast growth factor-1 and -2 and nerve growth factor were the only proteins in that group to show an early increase in the guide contents. As expected, several proteins involved in cell adhesion and motility; namely focal adhesion kinase, N-cadherin and β-catenin increased earlier in the proximal and distal segments than in the guide contents reflecting the relatively acellular matrix of the early regenerate.

Conclusions: In this study we identified changes in expression of multiple proteins over time linked to regeneration of the rat sciatic nerve both demonstrating the utility of reverse phase protein arrays in nerve regeneration research and revealing a detailed, composite spatiotemporal expression profile of peripheral nerve regeneration.


Figures

Figure 1
Figure 1
Antibody Validation: Validation of selected antibodies in western blot analysis showing detection of a single band for fibronectin (A), N-cadherin (B), β-catenin (C), E-cadherin (D), laminin γ-1 (E), nidogen (F), versican (G), FGF-2 (H), and CNTF (I).
Figure 2
Figure 2
GAP-43 RPPA: (A) RPPA probed with GAP-43 antibody showing an increase in protein expression over a 28-day regenerative period. (B) A graphic representation of the microarray showing the expression levels of GAP-43 over time in each segment.
Figure 3
Figure 3
Adhesion and Motility Protein Expression: Expression profiles of the adhesion and motility group of study proteins divided into proximal, guide and distal segments. Time (in days) is plotted on the X-axis and log normalized data on the Y axis.
Figure 4
Figure 4
Growth Factor Protein Expression: Expression profiles of the growth factor group of study proteins divided into proximal, guide and distal segments. Time (in days) is plotted on the X-axis and log normalized data on the Y axis.
Figure 5
Figure 5
ECM Protein Expression: Expression profiles of the ECM group of study proteins divided into proximal, guide and distal segments. Time (in days) is plotted on the X-axis and log normalized data on the Y axis.
Figure 6
Figure 6
Hierarchical Clustering Analysis in Heatmap Format: Proximal (A), distal (B), and solid guide content (C) samples are shown for each protein over time points of ≤ 7, 14, 21, and 28 days. Colors corresponding to relative levels of expression are shown at the bottom of each heatmap.

References

    1. Noble J, Munro CA, Prasad VS, Midha R. Analysis of upper and lower extremity peripheral nerve injuries in a population of patients with multiple injuries. J Trauma. 1998;45(1):116–122. doi: 10.1097/00005373-199807000-00025. - DOI - PubMed
    1. Terenghi G. Peripheral nerve regeneration and neurotrophic factors. J Anat. 1999;194(Pt 1):1–14. - PMC - PubMed
    1. Abe N, Cavalli V. Nerve injury signaling. Curr Opin Neurobiol. 2008;18(3):276–283. doi: 10.1016/j.conb.2008.06.005. - DOI - PMC - PubMed
    1. Lundborg G, Dahlin LB, Danielsen N, Gelberman RH, Longo FM, Powell HC, Varon S. Nerve regeneration in silicone chambers: influence of gap length and of distal stump components. Exp Neurol. 1982;76:361–375. doi: 10.1016/0014-4886(82)90215-1. - DOI - PubMed
    1. Danielsen N, Dahlin LB, Lee YF, Lundborg F. Axonal growth in mesothelial chambers. The role of the distal nerve segment. Scand J Plast Reconstr Surg. 1983;17(2):119–125. doi: 10.3109/02844318309013106. - DOI - PubMed