. 2012 Feb 8;102(3):417-26.
doi: 10.1016/j.bpj.2011.11.4022. Epub 2012 Feb 7.

Different cell fates from cell-cell interactions: core architectures of two-cell bistable networks

Affiliations

Different cell fates from cell-cell interactions: core architectures of two-cell bistable networks

Hervé Rouault et al. Biophys J. .

Abstract

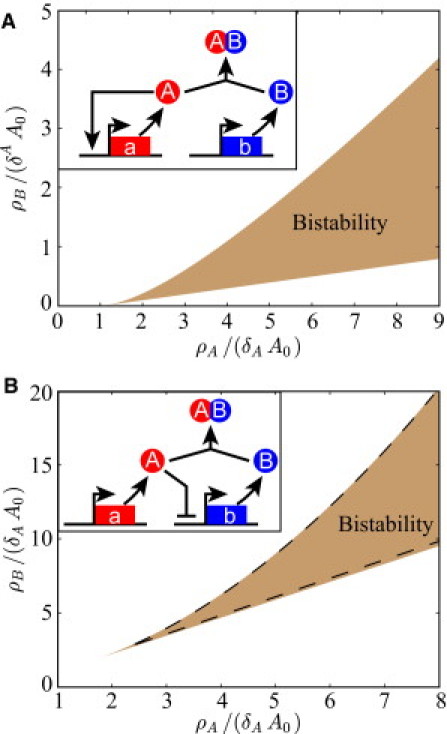
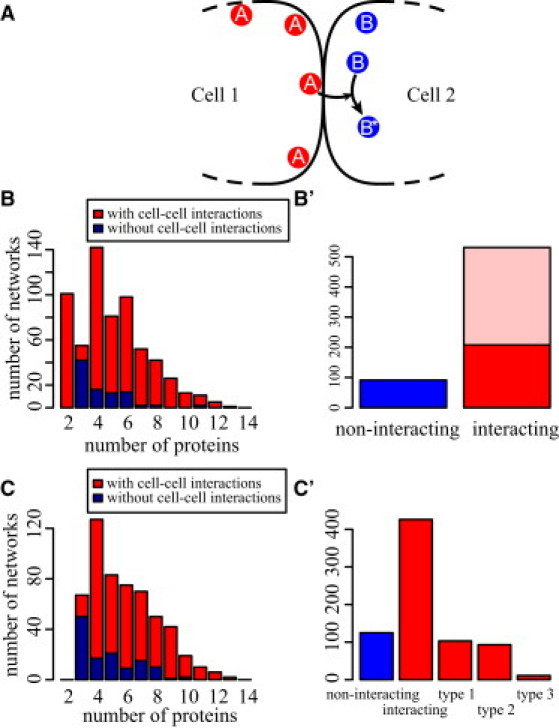
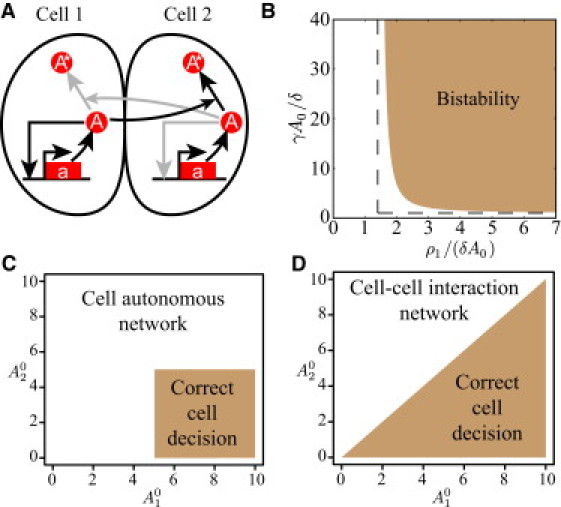
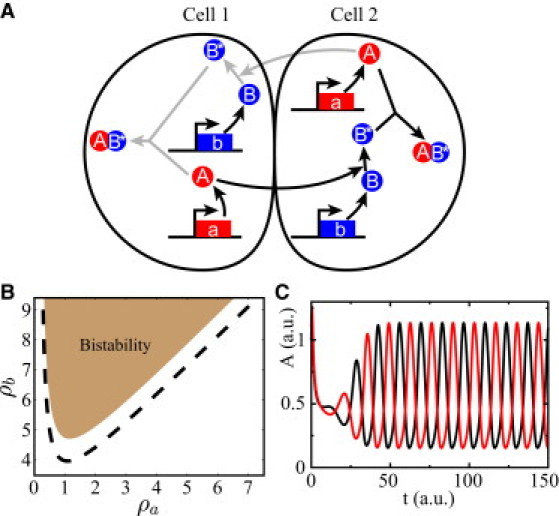
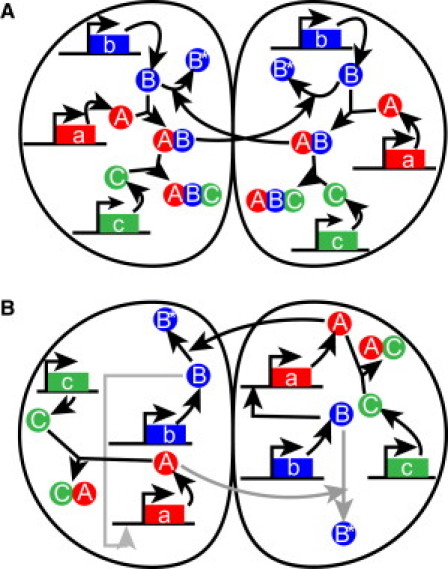
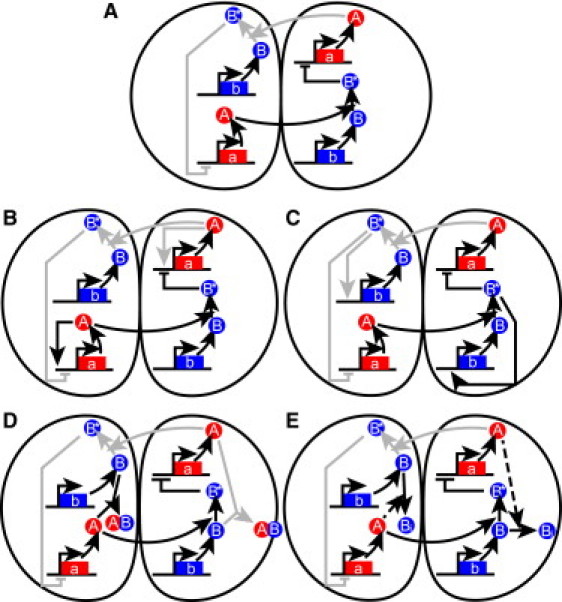
The acquisition of different fates by cells that are initially in the same state is central to development. Here, we investigate the possible structures of bistable genetic networks that can allow two identical cells to acquire different fates through cell-cell interactions. Cell-autonomous bistable networks have been previously sampled using an evolutionary algorithm. We extend this evolutionary procedure to take into account interactions between cells. We obtain a variety of simple bistable networks that we classify into major subtypes. Some have long been proposed in the context of lateral inhibition through the Notch-Delta pathway, some have been more recently considered and others appear to be new and based on mechanisms not previously considered. The results highlight the role of posttranscriptional interactions and particularly of protein complexation and sequestration, which can replace cooperativity in transcriptional interactions. Some bistable networks are entirely based on posttranscriptional interactions and the simplest of these is found to lead, upon a single parameter change, to oscillations in the two cells with opposite phases. We provide qualitative explanations as well as mathematical analyses of the dynamical behaviors of various created networks. The results should help to identify and understand genetic structures implicated in cell-cell interactions and differentiation.


Figures

Figure 1
Figure 1
Simple bistable networks that give two different stable states of gene expression. (A) AAC network (network depicted in the figure inset).The bistable region of the AAC network is shown in the parameter plane of dimensionless protein production rates (ρA / (δAA0), ρB / (δAA0)) (see the Supporting Material, section 2.1). (B) MFL (network depicted in the figure inset). The bistable region of the MFL is shown in the dimensionless protein production rate (ρA / (δAA0), ρB / (δAA0)) parameter plane. Note that in the MFL, complexation can be replaced by a catalytic modification of protein A by protein B. This is also the case for the AAC network when saturation of the catalyst is taken into account, as explained in the Supporting Material, section 2.
Figure 2
Figure 2
Interaction between two cells, description and statistics of the produced networks. (A) Schematic representation of the chosen interaction model between two cells. Protein A in the signal-sending cell (cell 1) induces a transformation in the signal-receiving cell (cell 2) of protein B into protein B. Of course, the reciprocal interaction between A in cell 2 and B in cell 1 also exists but is not pictured for clarity. See the Supporting Material, section 1.4 for the explicit mathematical description. (B) Numbers of created networks successfully producing two different fates in neighboring cells in 1000 evolutionary runs in which A and B can be identical in a signaling couple (A, B). The networks are sorted by the number of different proteins they use (a protein and its modified form(s), e.g., B, B and AB are all considered different so that, for instance, the AAC and MFL switches appear as three protein networks). (B′) Numbers of created networks that are either cell-autonomous (noninteracting) or that use homologous interaction with a signaling couple (A, A) (plain) or signaling between heterologous couples only (light) in the same simulation runs as in B. (C) Identical to (B) but when A and B in a signaling couple are required to be heterologous. (C′) Numbers of created networks that are either cell-autonomous (noninteracting) or use cell-interactions (interacting). The numbers of interacting networks of the three different types with <6 proteins and a single signaling pair are also shown (see main text for details).
Figure 3
Figure 3
Simplest network of two interacting cells with exclusive fates: interaction between homologous proteins in the signal-sending and signal-receiving cells. (A) Schematic explanation of the network dynamics in two cells that are in different states. Here and in the following pictures, gray arrows denote nonactive interactions whenever cell 1 is in the high A state. (B) Phase diagram of the two-cell network showing the parameter domain in the (ρ1, γ)-plane (ρ1: protein production rate, γ: interaction strength) for which bistability exists. In this parameter domain, the symmetry between the two cells is spontaneously broken and the two cells settle in different states. The precise definition of the parameters as well as the equations of the network are provided in the Supporting Material, section 2.4. (C) Sketch of the domain of initial A concentrations in which the first cell assumes a high A fate and the second one a low A fate for a cell-autonomous bistable switch. The chosen threshold of 5 for the high A state has been chosen arbitrarily. (D) Same as C, for a bistable network based on cell-cell interactions as the network depicted in A.
Figure 4
Figure 4
Two interacting cells with exclusive fates: type 1 network with interaction between heterologous proteins in the signal-sending and signal-receiving cells. (A) Schematic explanation of the network dynamic in two cells that are in different states. (B) Network phase diagram. The different dynamical regimes in the protein production rates (ρa, ρb)-parameter plane are shown in a case when the degradation rate of A is smaller than the degradation rate of B, δA = 1 < δB = 2. The region where the two-cell network is bistable and the two cells assume different states is shown. The dashed line is the approximate expression derived in the Supporting Material, section 2.4.2 (Eq. 2.56) for the bistability boundary, that is valid for rapid complexation between A and B. See the Supporting Material, section 3 for the network equations and precise definitions of the parameters. (C) Dynamical traces showing oscillations in the two-cell network (one curve for each cell) in different states when the degradation rate of B is smaller than the degradation rate of A (δA = 1 > δB = 0.25).
Figure 5
Figure 5
Two interacting cells with exclusive fates: type 2 networks with interaction between heterologous proteins in the signal-sending and signal-receiving cells. In this type of networks, the modified form of the signal-receiving protein does not interact with the rest of the network; the sole effect of the interaction is to lower the concentration of the unmodified signal-receiving protein. (A) This network, which is purely based on posttranscriptional interactions, was repeatedly produced. Note that B is the signal-receiving protein and that B has no interaction. The working principle of this network already appears quite complex but it can be understood based on our previous analysis of simpler bistable networks. Bistability is achieved when the production rate of B is smaller than the production rate of A and therefore controls the production of the complex AB. In this regime, transformation of B into B in a cell directly diminishes the production of the complex AB. Interaction between the two cells is then similar to noncooperative cross-repression between the production of the complexes AB in the two cells. Very similar to the AAC network, complexation of AB with C is needed to transform this monostable cross-repression, equivalent to a noncooperative self-activation, into a bistable network. (B) This network makes use of transcriptional and posttranscriptional interactions. The signal-receiving protein B stimulates the production of A, the signal-sending protein. Upon signal reception, B is transformed into B, which diminishes the signal-sending ability of the cell, an effect further amplified by the complexation of A with C.
Figure 6
Figure 6
Type 3 networks: interaction between heterologous proteins in the signal-sending and signal-receiving cells relayed by an inhibitory transcriptional interaction. In this third type of networks, the modified form of the signal-receiving protein inhibits the production of the signal sending protein, at the transcriptional level. (A) The simplest network. Bistability requires cooperative transcriptional interactions (Hill coefficient >1). When transcriptional interactions are noncooperative, supplementary interactions are required to break the symmetry between the two cells and to render the network bistable. (B) Autoactivation (with a Hill coefficient of 1) of its own gene by the signal-sending protein is a possibility that was commonly observed. (C) Activation of the gene coding for the signal receiving-protein by the modified signal-receiving protein is also an observed case. (D) The addition of a complexation between the signal-sending protein A and the signal-receiving protein B is another possibility with a supplementary posttranscriptional interaction. When A is high in the receiving cell, this complexation prevents the existence of free B and signal reception (i.e., the creation of B). Reciprocally when B is high, complexation lowers the concentration of free A and diminishes the ability of the cell to signal. It has thus been termed mutual cis-inhibition in the context of the Notch-Delta pathway. (E) A related possibility that was also observed is that the signal-sending protein A catalyzes in its own cell the transformation the signal-receiving protein B into an inactive form Bi. In this case, there is cis-inhibition of B by A, but no mutual cis-inhibition.

References

    1. Artavanis-Tsakonas S., Rand M.D., Lake R.J. Notch signaling: cell fate control and signal integration in development. Science. 1999;284:770–776. - PubMed
    1. Wilkinson H.A., Fitzgerald K., Greenwald I. Reciprocal changes in expression of the receptor lin-12 and its ligand lag-2 prior to commitment in a C. elegans cell fate decision. Cell. 1994;79:1187–1198. - PubMed
    1. Sternberg P.W. Vulval development. WormBook. 2005;25:1–28. - PMC - PubMed
    1. Heitzler P., Simpson P. The choice of cell fate in the epidermis of Drosophila. Cell. 1991;64:1083–1092. - PubMed
    1. Henrique D., Adam J., Ish-Horowicz D. Expression of a Delta homologue in prospective neurons in the chick. Nature. 1995;375:787–790. - PubMed

Publication types

LinkOut - more resources