. 2012 Feb 10;45(3):330-43.
doi: 10.1016/j.molcel.2011.11.032.

Direct recruitment of polycomb repressive complex 1 to chromatin by core binding transcription factors

Affiliations

Direct recruitment of polycomb repressive complex 1 to chromatin by core binding transcription factors

Ming Yu et al. Mol Cell. .

Abstract

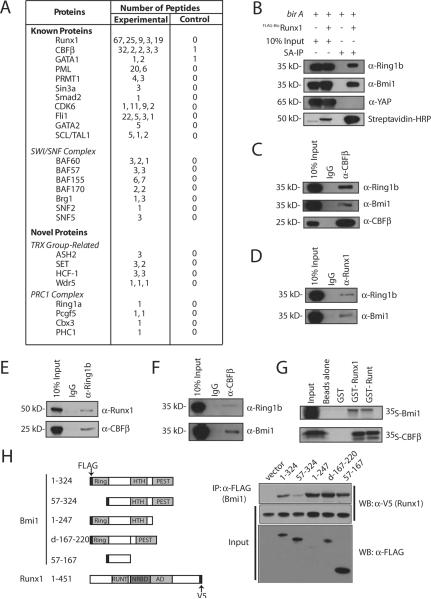
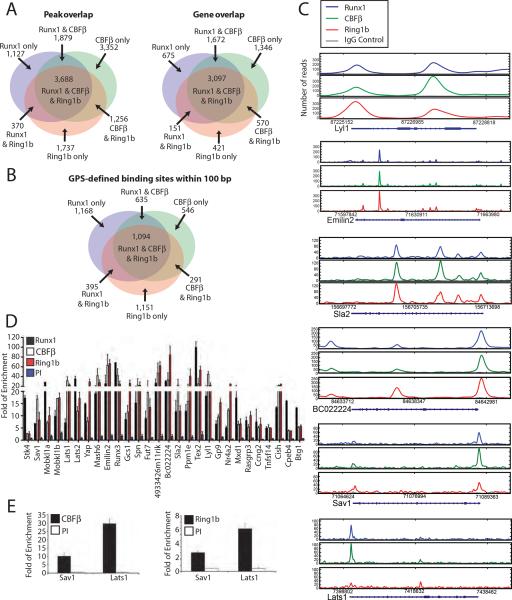
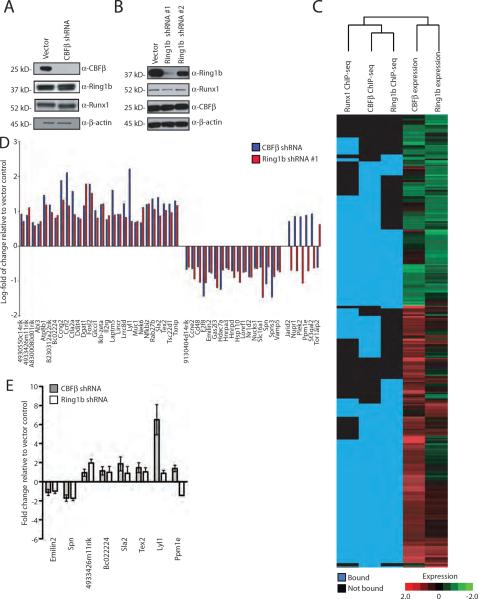
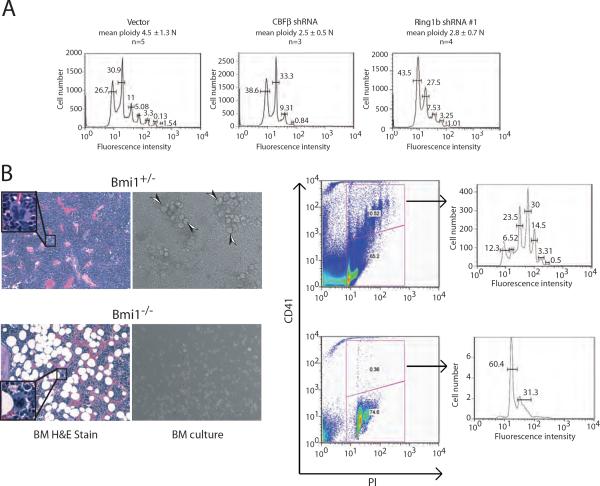
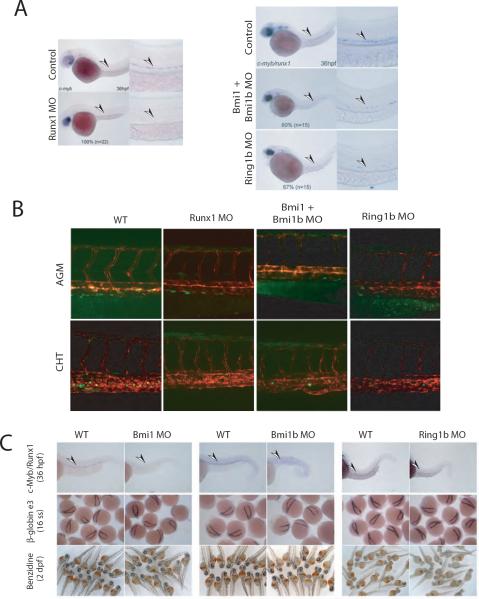
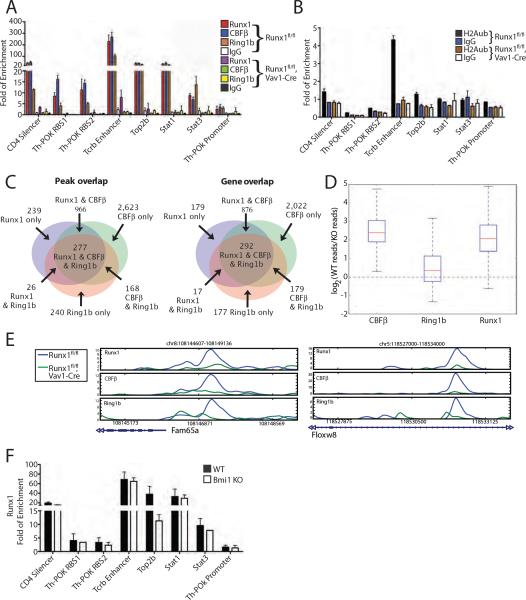
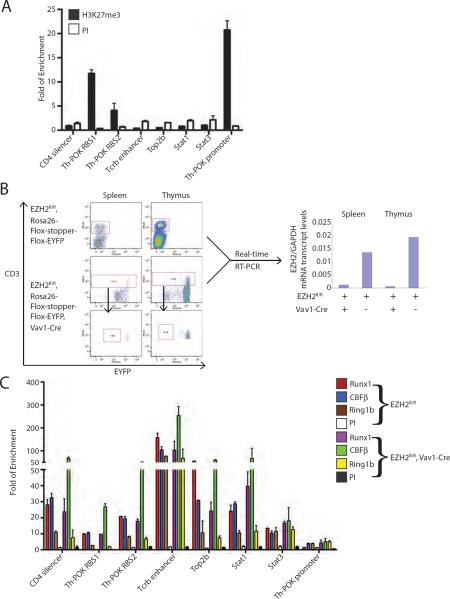
Polycomb repressive complexes (PRCs) play key roles in developmental epigenetic regulation. Yet the mechanisms that target PRCs to specific loci in mammalian cells remain incompletely understood. In this study we show that Bmi1, a core component of Polycomb Repressive Complex 1 (PRC1), binds directly to the Runx1/CBFβ transcription factor complex. Genome-wide studies in megakaryocytic cells demonstrate significant chromatin occupancy overlap between the PRC1 core component Ring1b and Runx1/CBFβ and functional regulation of a considerable fraction of commonly bound genes. Bmi1/Ring1b and Runx1/CBFβ deficiencies generate partial phenocopies of one another in vivo. We also show that Ring1b occupies key Runx1 binding sites in primary murine thymocytes and that this occurs via PRC2-independent mechanisms. Genetic depletion of Runx1 results in reduced Ring1b binding at these sites in vivo. These findings provide evidence for site-specific PRC1 chromatin recruitment by core binding transcription factors in mammalian cells.


Figures

Figure 1
Figure 1
Physical association between Runx1/CBFβ and Ring1b/Bmi1. (A) Partial list of proteins identified by mass spectrometry following tandem anti-FLAG:SA or single SA affinity chromatography from crude nuclear extracts ofFLAG-BioRunx1 + biotin ligase birA (experimental) or birA alone (control) containing L8057 cells treated with TPA for 72 hrs (Huang et al., 2009). The number of peptides obtained for each protein from each of 5 independent experiments is shown. See Supplemental Figure S1 and Supplemental Table S1 for additional details. (B) Western blot for Ring1b, Bmi1 and YAP following SA-IP of FLAG-BioRunx1 complexes from TPA-induced L8057 cells. Ten percent input is shown. (C–E) Co-IP assays of endogenous proteins from TPA-induced L8057 cells. The IP antibody is shown on top, and the WB antibody is shown on the right. Ten percent input is shown. IgG, species matched control antibody. (F) Western blot for Ring1b and Bmi1 following IP with α-CBFβ antibody, or control IgG, from Jurkat T cells. Ten percent input is shown. (G) GST pull-down assay of recombinant Runx1, Bmi1 and CBFβ. In vitro transcribed and translated [35S]-methionine labeled Bmi1 or CBFβ was incubated with uncoupled beads or beads coupled with GST, GST-Runx1 or GST-runt domain fusion proteins as indicated. The beads were washed and eluted material was separated by SDS-PAGE. An autoradiogram is shown. Ten percent of the input protein is shown. (H) Mapping of Bmi1 interaction domain. Left, schematic diagram of constructs. Right, α-FLAG IP followed by α-V5 Western blot of constructs co-expressed in COS7 cells. One percent of input is shown.
Figure 2
Figure 2
Common chromatin site occupancy by Runx1/CBFβ and Ring1b. (A) Venn diagrams showing overlap of Runx1, CBFβ, and Ring1b occupancy peaks (left) and genes (right) in TPA-induced L8057 cells based on MACS (Zhang et al., 2008). Overlapping peaks are defined as those for which the summits of the peaks are < 500 bp from each other. Bound genes are defined as having occupancy peaks between −1kb of the TSS to +1kb of the TES. (B) Venn diagram showing overlap of Runx1, CBFβ, and Ring1b occupancy sites within 100 bp of one another based on GPS (Guo et al., 2010). (C) Representative Runx1, CBFβ, Ring1b, and control IgG ChIP-seq profiles of loci occupied by Runx1, CBFβ and Ring1b. Other genes present in these regions are not shown. (D) qChIP assays for Runx1, CBFβ and Ring1b occupancy at the indicated loci in TPA-induced L8057 cells. PI, control antibody. The data is expressed as fold enrichment relative to a negative control region (−2.5 kb 5' of the Gapdhs gene TSS), and represent the mean of 3 independent experiments ± standard deviation (std dev). (E) qChIP assays for CBFβ and Ring1b occupancy at Sav1 and Lats1 gene promoters in primary fetal liver derived murine Mks. The data are displayed as in “D”.
Figure 3
Figure 3
Regulation of a subset of commonly bound CBFβ and Ring1b direct target genes. (A) CBFβ lentiviral shRNA knock down in TPA-induced L8057 cells. Western blot for CBFβ, Ring1b, Runx1, and β-actin in puromycin selected cells. (B) Ring1b lentiviral shRNA knock down in TPA-induced L8057 cells. Western blot for Ring1b, Runx1, CBFβ and β-actin in puromycin selected cells. (C) Clustering analysis showing genes occupied by either Runx1, CBFβ and/or Ring1b at −1kb of TSS to +1kb of TES, and heat map of corresponding gene expression changes (red, increased; green, decreased; black, no change) following CBFβ or Ring1b shRNA knock down. (D) Log-fold gene expression changes based on cDNA microarray analysis for genes bound by at all 3 factors (Runx1, CBFβ, and Ring1b) (p-value <1E-10, FDR < 5%; occupancy −1kb of the TSS to +1 kb from the TES) that changed expression following bothβ and Ring1b shRNA knock down ≥ 1.5 fold with p-value < 0.05. (E) qRT-PCR measurements of gene expression changes of representative commonly occupied genes following CBFβ or Ring1b shRNA knock down in TPA-induced L8057 cells. Levels are normalized to Gapdhs. The mean of 4 independent experiments is shown ± std dev.
Figure 4
Figure 4
Partial phenocopies of Ring1b/Bmi1 and Runx1/CBFβ deficiency in megakaryopoiesis. (A) Representative flow cytometric plots of propidium iodide (PI) DNA ploidy analysis of TPA-induced L8057 cells transduced with the empty vector, CBFβ shRNA, or Ring1b shRNA #1. The percentages of cells with each DNA ploidy state (2N, 4N, 16N, 32N, 64N and 128N) and the mean ploidy (vector (n=5), CBFb shRNA (n=3), Ring1b shRNA #1 (n=4)) are given ± std dev. (B) Phenotype of Bmi1−/− Mks. Left panel, hematoxylin and eosin stained histologic sections of bone marrow from Bmi1+/− mice. Inset shows representative Mk at higher magnification (original 600×). Middle panel, phase contrast photomicrograph of bone marrow cells cultured from Bm1+/− and Bmi1−/− mice in the presence Tpo and stem cell factor. Arrowheads indicate large (maturing) Mks. Right panel, flow cytometric plots of cultured bone marrow cells for CD41 expression and DNA content (PI). Histogram plots for different ploidy classes are shown to the right for CD41+ gated cells. Gates were set using control IgG stained cells.
Figure 5
Figure 5
Partial phenocopies of Ring1b/Bmi1 and Runx1/CBFβ deficiency in definitive HSC ontogeny. (A) Left panel, in situ hybridization for c-Myb in 36 hours post fertilization (hpf) uninjected control and Runx1 morphant zebrafish embryos. Low magnification (10×) (left) and high magnification (40×) images of the trunk region (right) are shown. MO, morpholino. The percentage of embryos with the represented phenotype is indicated. Right panel, in situ hybridization for c-Myb/Runx1 in 36 hpf uninjected control or embryos injected at the single cell stage with Bmi1, Bmi1b and/or Ring1b translation blocking MOs. Arrowheads indicate phenotypic HSCs. (B) MO injection into transgenic CD41-eGFP: flk1-RFP double transgenic embryos. eGFP+ cells (green) represent HSPCs and thrombocytes, RFP+ cells (red) represent vasculature. The AGM region was visualized at 36 hpf, and the CHT was visualized 3 days later. (C) Upper row, in situ hybridization for c-Myb and Runx1 at 36 hrs hpf in zebrafish embryos injected with Bmi1, Bmi1b, or Ring1b MOs, compared to wild type (WT) embryos. Middle row, ε3-globin in situ hybridization at the 16-somite stage (ss). Lower row, o-dianosidine (benzidine) stains of 2 days post fertilization (dpf) embryos. Hemoglobinized cells stain orange/brown.
Figure 6
Figure 6
Runx1 dependency of Ring1b chromatin occupancy at commonly bound sites in primary murine thymocytes. (A) qChIP assays for Runx1, CBFβ and Ring1b in primary thymocytes from either Runx1fl/fl or Runx1fl/fl, Vav1-Cre 6-week old mice. Fold of enrichment is shown relative to a negative control region (see Methods). The mean of 3 independent assays is shown ± std dev. (B) qChIP assay for H2Aub at each of the individual sites tested in “A”. (C) Venn diagrams showing overlap of Runx1, CBFβ and Ring1b peaks and bound genes from primary thymocytes of 5–8 week old Runx1fl/fl mice. Peaks are filtered for p-value < 1E-10, FDR < 5% and overlaps are defined as MACS summits within 500 bp of each other. Bound genes contain occupancy peaks within −1kb of the TSS to + 1kb of the TES. (D) Ratio of the number of reads obtained from ChIP-seq for CBFβ, Ring1b, and Runx1 at commonly occupied sites in thymocytes from Runx1fl/fl versus Runx1fl/fl, Vav1-Cre mice in log-base-2. The red horizontal bars represent the median value, the boxes represent the 25th–75th%ile range, and the whiskers extend to the most extreme data point within 1.5× of the inner quartile. The expected log-ratios based on the number of reads in each experiment are −0.29 for CBFβ, −0.51 for Ring1b, and 0.25 for Runx1. (E) Examples of ChIP-seq profiles showing concomitant reduction of Runx1, CBFβ and Ring1b occupancy at commonly occupied sites. (F) qChIP assays for Runx1 in primary thymocytes from 5–6 week old Bmi1−/− or wild type littermate controls. The mean of 3 independent assays is shown ± std dev.
Figure 7
Figure 7
PRC2 independent occupancy of Ring1b at Runx1/CBFβ commonly occupied genes. (A) qChIP assays for H3K27me3 at each of the indicated sites in wild type murine primary thymocytes. The mean of 3 independent assays is shown ± std dev. (B) Left panel, flow cytometry for CD3 and EYFP expression from spleen or thymus of EZH2fl/fl, Rosa26-flox-stopper-flox-EYFP and EZH2fl/fl, Rosa26-flox-stopper-flox-EYFP, Vav1-Cre mice. Right panels, qRT-PCR analysis for EZH2 mRNA transcript levels in corresponding splenic or thymic CD3+ cells. (C) qChIP assays for Runx1, CBFβ and Ring1b in primary thymocytes from 6–8 week old EZH2fl/fl, Rosa26-flox-stopper-flox-EYFP or EZH2fl/fl, Rosa26-flox-stopper-flox-EYFP, Vav1-Cre littermates. The data is expressed as fold enrichment relative to a negative control region (see Methods). The data represent the mean of 3 independent experiments for Ring1b, and 2 independent experiments for Runx1 and CBFb ± std. dev.

References

    1. Appleford PJ, Woollard A. RUNX genes find a niche in stem cell biology. J Cell Biochem. 2009;108:14–21. - PubMed
    1. Bakshi R, Hassan MQ, Pratap J, Lian JB, Montecino MA, van Wijnen AJ, Stein JL, Imbalzano AN, Stein GS. The human SWI/SNF complex associates with RUNX1 to control transcription of hematopoietic target genes. J Cell Physiol. 2010;225:569–576. - PMC - PubMed
    1. Bejar R, Stevenson K, Abdel-Wahab O, Galili N, Nilsson B, Garcia-Manero G, Kantarjian H, Raza A, Levine RL, Neuberg D, Ebert BL. Clinical effect of point mutations in myelodysplastic syndromes. N Engl J Med. 2011;364:2496–2506. - PMC - PubMed
    1. Burns CE, DeBlasio T, Zhou Y, Zhang J, Zon L, Nimer SD. Isolation and characterization of runxa and runxb, zebrafish members of the runt family of transcriptional regulators. Exp Hematol. 2002;30:1381–1389. - PubMed
    1. Burns CE, Traver D, Mayhall E, Shepard JL, Zon LI. Hematopoietic stem cell fate is established by the Notch-Runx pathway. Genes Dev. 2005;19:2331–2342. - PMC - PubMed

Publication types

MeSH terms