. 2012 Feb 8;15(2):171-85.
doi: 10.1016/j.cmet.2012.01.004.

Altered mitochondrial function and metabolic inflexibility associated with loss of caveolin-1

Affiliations

Altered mitochondrial function and metabolic inflexibility associated with loss of caveolin-1

Ingrid Wernstedt Asterholm et al. Cell Metab. .

Abstract

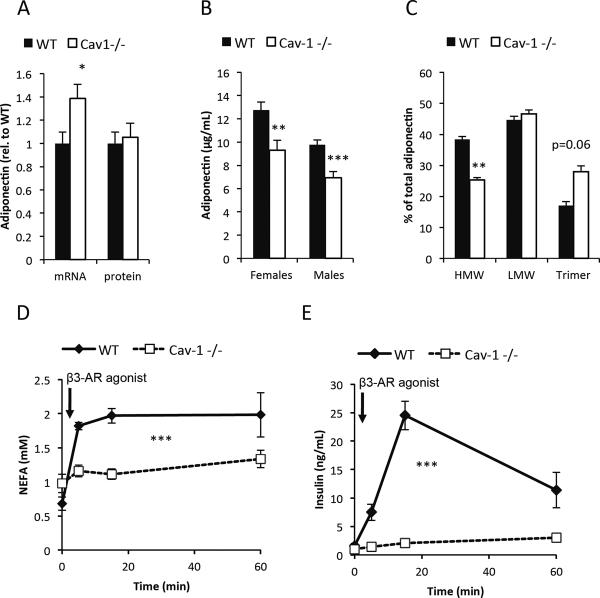
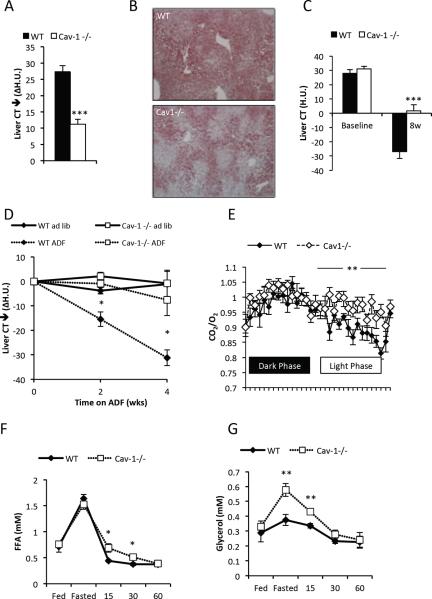
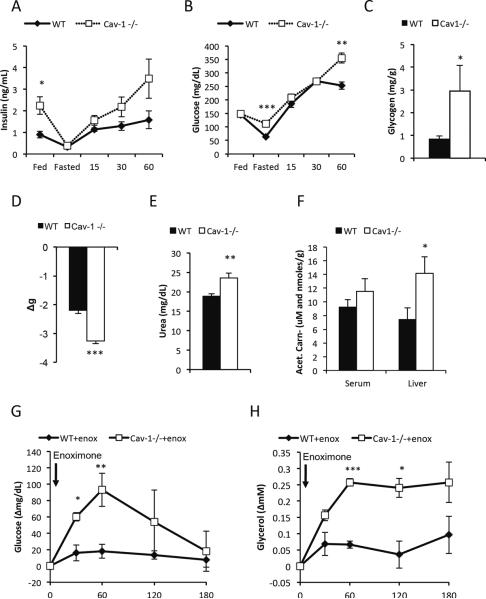
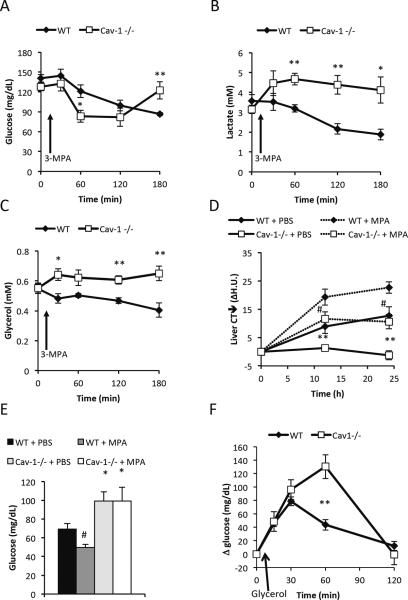
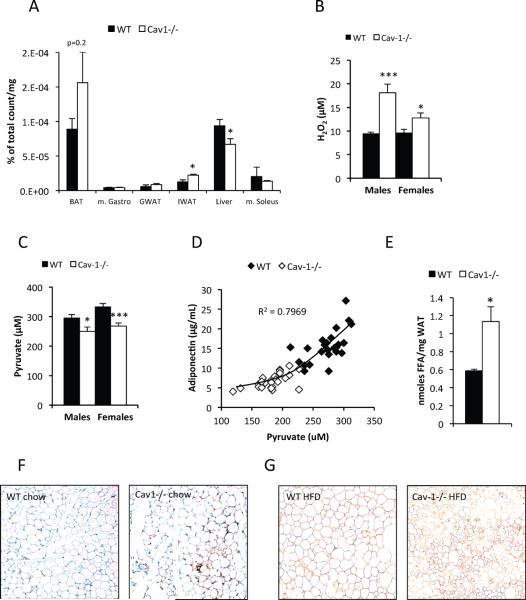
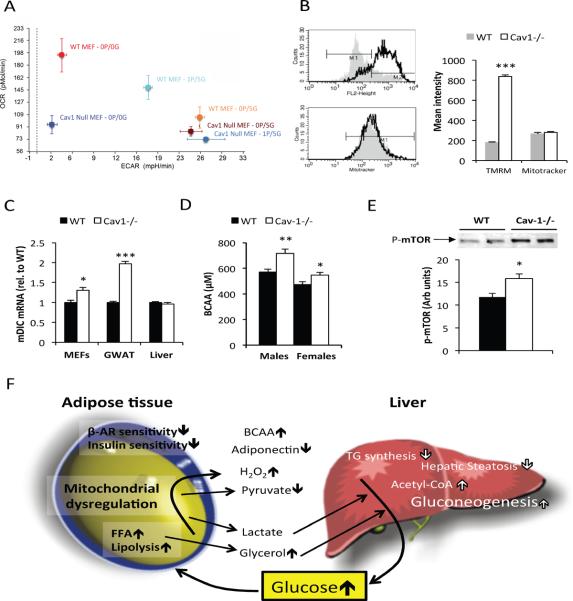
Caveolin-1 is a major structural component of raft structures within the plasma membrane and has been implicated as a regulator of cellular signal transduction with prominent expression in adipocytes. Here, we embarked on a comprehensive characterization of the metabolic pathways dysregulated in caveolin-1 null mice. We found that these mice display decreased circulating levels of total and high molecular weight adiponectin and a reduced ability to change substrate use in response to feeding/fasting conditions. Caveolin-1 null mice are extremely lean but retain muscle mass despite lipodystrophy and massive metabolic dysfunction. Hepatic gluconeogenesis is chronically elevated, while hepatic steatosis is reduced. Our data suggest that the complex phenotype of the caveolin-1 null mouse is caused by altered metabolic and mitochondrial function in adipose tissue with a subsequent compensatory response driven mostly by the liver. This mouse model highlights the central contributions of adipose tissue for system-wide preservation of metabolic flexibility.


Figures

Figure 1
Figure 1. Caveolin-1 null mice display reduced circulating adiponectin levels and reduced sensitivity to β3-AR agonist
(A): mRNA and protein levels of adiponectin in 3 month old male mice (n=7–11 per group); (B): circulating levels of adiponectin in 2 month old mice (n=10–12 per group); (C): adiponectin complex distribution in male mice match for total levels of adiponectin (n=3 per group). (D) and (E): FFA and insulin response to β3-AR agonist (1mg/kg i.p.) in 2 months old male mice (n=4–5 per group). The error bars indicate SEM.
Figure 2
Figure 2. Reduced hepatic steatosis, reduced response to ADF, lower RER variability, but normal levels of fasting-induced FFAs the caveolin-1 null mice
Hepatic steatosis was assessed by CT measurements before and after a 24h fast (A) (note that the difference is plotted); (B) Representative ORO stain of livers from 24h fasted mice. Hepatic steatosis was assessed after 8 weeks of HFD feeding ad libitum (C) and followed by 4 weeks HFD feeding ADF or ad libitum HFD (D). Chow-fed mice were acclimatized to the metabolic cages for 4 days and on the 5th day RER (E) was recorded. Male mice 3–4 months old were used for panel A–E (n=4–10 per group). (F–G) show the levels of circulating FFAs and glycerol in the fed state at 7pm, 24h fasted state at 7pm and 15, 30 and 60 minutes after re-feeding (n=5 per group; 12 week old female cohorts used). The error bars indicate SEM.
Figure 3
Figure 3. Caveolin-1 null mice have increased fasting glucose levels, increased breakdown of amino acids and an enhanced response to phospodiesterase inhibitor
(A–B)show the levels of circulating insulin and glucose in the fed state at 7pm, 24h fasted state at 7pm and 15, 30 and 60 minutes after re-feeding; (C) Glycogen levels in 5 hour fasted male mice (12 weeks old; n=5 per group); (D) Weight loss after 24h fasting. Circulating urea (E) and circulating as well as hepatic acetyl-carnitine levels (F) were measured in 5h male fasted mice (3 months old; n=7–9 per group). Enoximone (10 mg/kg i.p.) were injected to 5 hours fasted male mice (4 months old; n=3–5 per group) (G–H): Enoximone-induced changes in glucose and glycerol levels. The error bars indicate SEM.
Figure 4
Figure 4. Caveolin-1 null mice display an altered response the PEPCK inhibition
Acute response to PEPCK inhibition: 12 week old female cohorts were fasted for 5h at daytime prior to intra-gastric administration of 30mg/kg 3-MPA (n=5 per group). Glucose levels were transiently lowered (A), while lactate (B) and glycerol (C) increased in the caveolin-1 null mice. Chronic response to PEPCK inhibition: Fasting-induced hepatic steatosis, followed by CT in female mice (8 month old; n=5 per group), was aggravated in presence of PEPCK inhibitor (D). Glucose levels were measured at the end of the time course and remained higher in both PBS and 3-MPA treated caveolin-1 null mice (E). (F) Glycerol-induced glucose production measured in PEPCK-inhibited female mice (3 months old; n=4–5 per group) was higher in caveolin-1 nulls indicating that the higher glucose levels in caveolin-1 null mice during fasting is mediated by an increase in glycerol-induced gluconeogenesis. The error bars indicate SEM.
Figure 5
Figure 5. Caveolin-1 deficiency results in reduced hepatic triglyceride synthesis, increase in reactive oxygen species, elevated adipose tissue FFAs and increased macrophage infiltration
(A) Intravenous infusion of 3H-triolein in mice fasted for 5h and reveals a reduced hepatic triglyceride synthesis in the liver of caveolin-1 null mice. Note that the 3H count in the organic phase of adipose tissue (BAT and IWAT) was increased in the caveolin-1 null mice. This indicates an increase in triglyceride synthesis rate; (B) and (C): Circulating H2O2 and pyruvate levels in 2 month old mice after 5h of fasting (n=10−12 per group). (D) Adiponectin and pyruvate levels measured in female 4 month old mice were positively correlated. (E) Local FFA levels from gonadal adipose tissue pieces (n=4+4) obtained from 5 month old females. (F) and (G) Gonadal adipose tissue stained for respectively mac2 and perilipin. The error bars indicate SEM.
Figure 6
Figure 6. Altered mitochondrial function in Cav-1 null cells
(A) Caveolin-1 −/− MEFs display a preference for glycolysis. Cells were incubated in various concentrations (in mM) of pyruvate (P) and glucose (G) as indicated. Oxygen consumption rate (OCR) and extracellular acidification rate (ECAR) were measured in a Seahorse XF flux analyzer. (B) Caveolin-1 null cells have a higher mitochondrial membrane potential as judged by TMRM fluorescence intensity. (C) Comparison of wildtype and caveolin-1 null dicarboxylate carrier (mDIC) mRNA levels in MEFs, adipose tissue and liver. All measurements in MEFs reflect triplicate measurements. (D) BCAA levels after 5h of fasting in 2 month old mice (n=10−12 per group). (E) Phospho-mTOR levels were measured in m. gastrocnemius in 5h fasted, 3 month old male mice (n=6 per group). (F) Schematic representation of caveolin-1 null phenotype: Caveolin-1 deficiency leads to a reduced sensitivity to insulin and adrenergic agonists, elevated basal lipolysis, and is associated with altered mitochondrial function in adipose tissue. These defects have a profound impact on whole body metabolism. In the caveolin-1 null mice, we observe a dramatically enhanced hepatic glucose production as well as an increase in BCAA levels (likely due to increased food intake). We hypothesize that the elevated lipolysis and the altered mitochondrial function in adipose tissue (and possibly other tissues) exposes the liver to elevated levels of gluconeogenic substrates. The elevated BCAA levels both enhance fatty acid oxidation and increase anabolic processes in skeletal muscle. The error bars indicate SEM.

References

    1. Adams SH, Hoppel CL, Lok KH, Zhao L, Wong SW, Minkler PE, Hwang DH, Newman JW, Garvey WT. Plasma acylcarnitine profiles suggest incomplete long-chain fatty acid beta-oxidation and altered tricarboxylic acid cycle activity in type 2 diabetic African-American women. J Nutr. 2009;139:1073–1081. - PMC - PubMed
    1. Anderson EJ, Yamazaki H, Neufer PD. Induction of endogenous uncoupling protein 3 suppresses mitochondrial oxidant emission during fatty acid-supported respiration. The J Biol Chem. 2007;282:31257–31266. - PubMed
    1. Asterholm IW, Halberg N, Scherer PE. Mouse Models of Lipodystrophy Key reagents for the understanding of the metabolic syndrome. Drug Discov Today Dis Models. 2007;4:17–24. - PMC - PubMed
    1. Asterholm IW, Scherer PE. Enhanced metabolic flexibility associated with elevated adiponectin levels. Am J Pathol. 2010;176:1364–1376. - PMC - PubMed
    1. Babich H, Liebling EJ, Burger RF, Zuckerbraun HL, Schuck AG. Choice of DMEM, formulated with or without pyruvate, plays an important role in assessing the in vitro cytotoxicity of oxidants and prooxidant nutraceuticals. In Vitro Cell Dev Biol Anim. 2009;45:226–233. - PubMed

Publication types