. 2012 Apr 20;418(1-2):65-81.
doi: 10.1016/j.jmb.2012.02.005. Epub 2012 Feb 9.

Hypermutation of ApoB mRNA by rat APOBEC-1 overexpression mimics APOBEC-3 hypermutation

Affiliations

Hypermutation of ApoB mRNA by rat APOBEC-1 overexpression mimics APOBEC-3 hypermutation

Zhigang Chen et al. J Mol Biol. .

Abstract

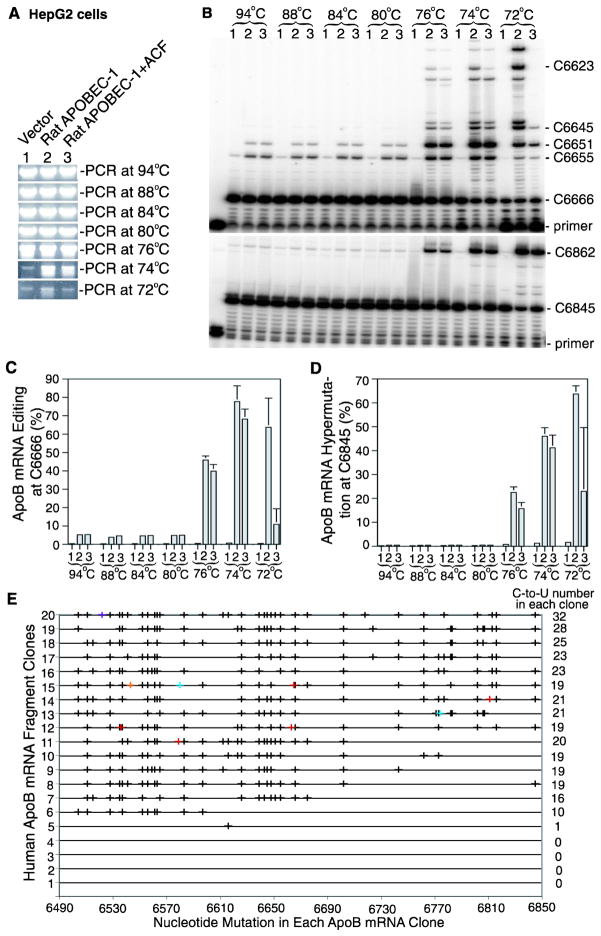
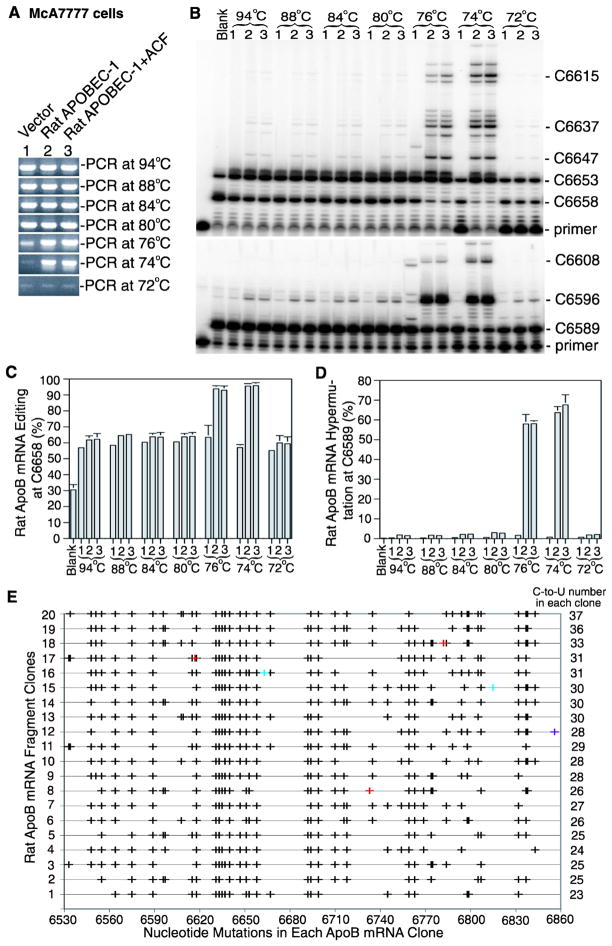
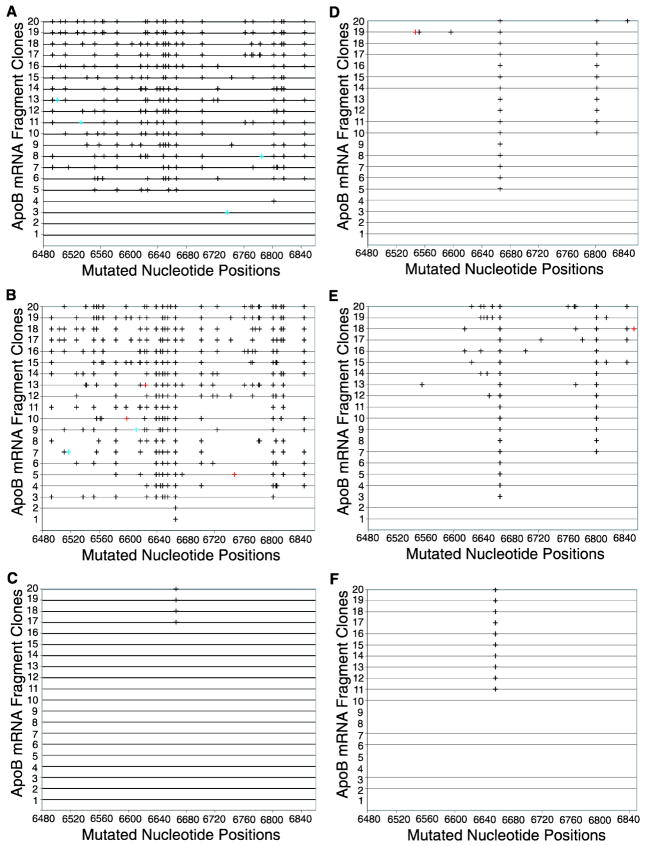
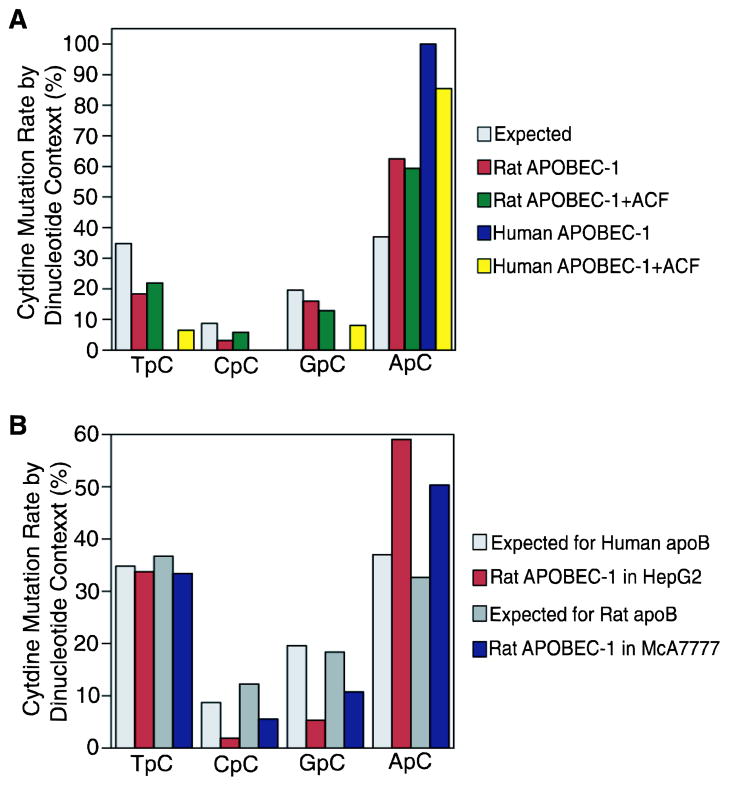
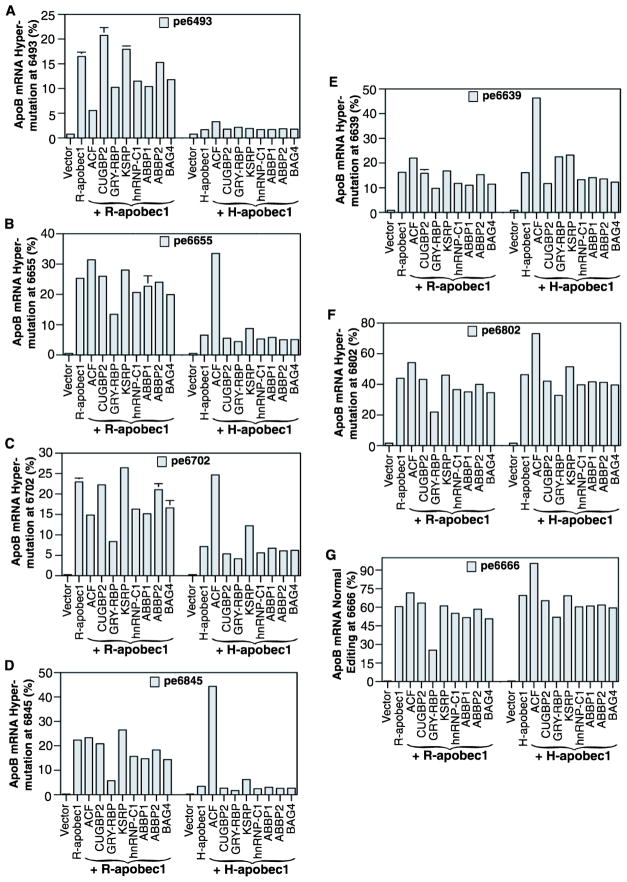
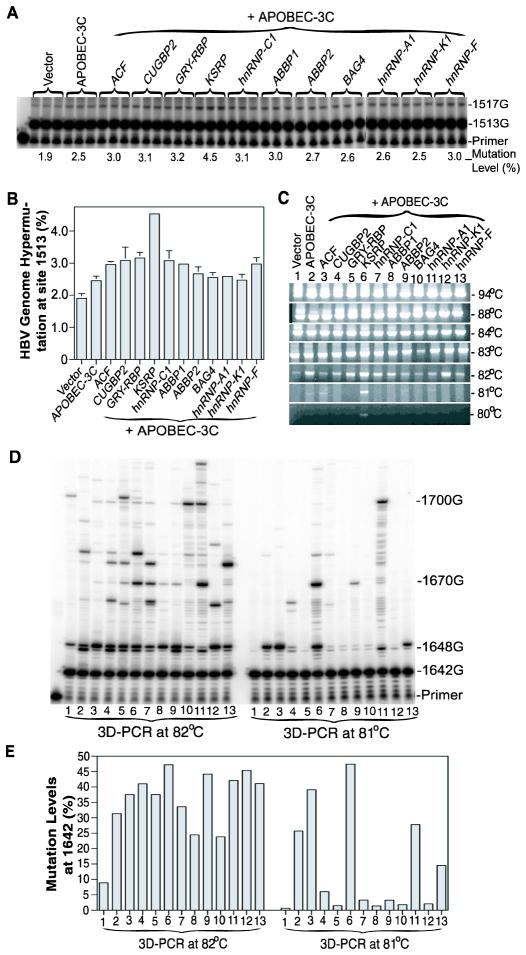
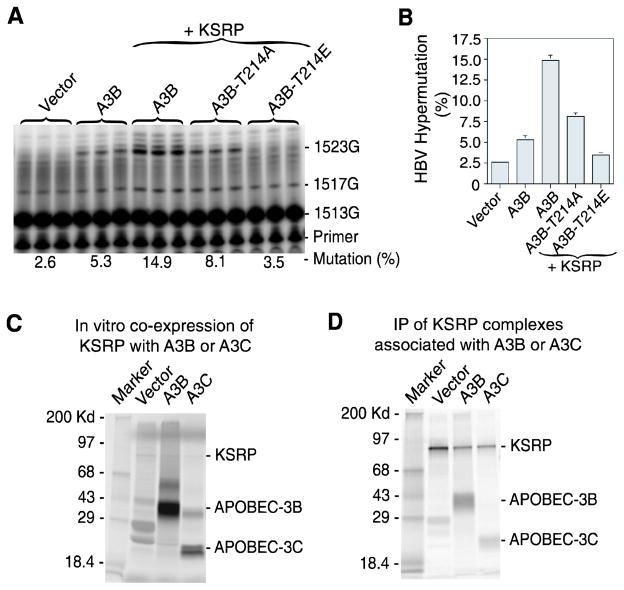
APOBEC-3 proteins induce C-to-U hypermutations in the viral genome of various viruses and have broad antiviral activity. Generally, only a small proportion of viral genomes (<10(-)(2)) are hypermutated by APOBEC-3s, but often many cytidines (up to 40%) are converted into uridine. The mechanism of this unique selective hypermutation remains unknown. We found that rat APOBEC-1 overexpression had a hypermutation pattern similar to that of APOBEC-3s on its substrate apolipoprotein B (apoB) mRNA. Transient plasmid transfection of rat APOBEC-1 resulted in 0.4% and 1.8% hypermutations with apoB mRNA in HepG2 and McA7777 cells, respectively. The low frequency of hypermutated apoB mRNA targets was enriched by differential DNA denaturation PCR at 72-76 °C, with hypermutation levels increasing up to 67%. Up to 69.6% of cytidines in HepG2 and up to 75.5% of cytidines in McA7777 cells were converted into uridines in the hypermutated apoB mRNA. When rat APOBEC-1 was overexpressed by adenovirus, the hypermutation frequency of apoB mRNA increased from 0.4% to ∼20% and was readily detected by regular PCR. However, this higher expression efficiency only increased the frequency of hypermutation, not the number of affected cytidines in hypermutated targets. Rat APOBEC-1 hypermutation was modulated by cofactors and eliminated by an E181Q mutation, indicating the role of cofactors in hypermutation. The finding of an APOBEC-3 hypermutation pattern with rat APOBEC-1 suggests that cofactors could also be involved in APOBEC-3 hypermutation. Using hepatitis B virus hypermutation, we found that KSRP increased APOBEC-3C and APOBEC-3B hypermutation. These data show that, like rat APOBEC-1 hypermutation, cellular factors may play a regulatory role in APOBEC-3 hypermutation.


Figures

Figure 1
Figure 1. Rat APOBEC-1 over-expression hypermutates apoB mRNA in HepG2 cells
Rat APOBEC-1 was expressed in HepG2 cells with or without rat ACF by transient plasmid transfection. Total RNAs were extracted after a 2 day transfection. The apoB mRNA (6471–6886 nt) was amplified by RT-PCR. The PCR reactions were diluted 1:10 and subjected to 3D-PCR amplification at different denaturing temperatures. The hypermutated apoB mRNA enriched by the 3D-PCR were further analyzed by primer extension and sequencing. A, Detection of 3D-PCR amplifications at different denaturing temperatures by 1% agarose gel electrophoresis with ethidium bromide staining. B, Detection of the hypermutated apoB mRNA in the 3D-PCR amplifications by primer extension analyses. The 3D-PCR amplifications as in figure 1A were subjected to primer extension analyses with primers for editing at the physiological site 6666 (top panel) or for hypermutation at site 6845 (bottom panel). The resultant primer extension products were separated by 8% polyacrylamide urea gel electrophoresis and quantified using a PhosphoImager. C, and D, Graphical presentation of the data obtained from three repeats as in figure 1B for editing levels at site 6666 (C) and hypermutation levels at site 6845 (D). Each bar represents the mean and standard deviation with n=3. E, Sequencing analyses of the 3D-PCR amplifications at 74°C. The 3D-PCR amplifications at 74°C were cloned and 20 clones were randomly selected for DNA sequencing to determine apoB mRNA hypermutation. The C-to-U mutations detected in each clone are graphically presented in black by each individual clone number vs sites of mutation. Other minor nucleotide conversions are marked as follows, A/G, red; T/C, bright blue; A/C, orange; and A/G, purple. The graph right side numbers indicate how many C-to-U conversions are detected in the single clone.
Figure 2
Figure 2. Rat APOBEC-1 over-expression hypermutates apoB mRNA in McA7777 cells
Rat APOBEC-1 was expressed in McA7777 cells with or without rat ACF by transient plasmid transfection as in Fig. 1. Total RNAs were extracted after a 2 day transfection. The rat apoB mRNA (6507–6878 nt) was amplified by RT-PCR and was followed by apoB mRNA hypermutation analyses with 3D-PCR, primer extension, and sequencing. A, Detection of apoB mRNA 3D-PCR amplifications at different denaturing temperatures by 1% agarose gel electrophoresis. B, Primer extension analyses of the hypermutated apoB mRNA in the 3D-PCR amplifications. The 3D-PCR amplifications as in figure 2A were subjected to primer extension analyses with primers for editing at the physiological site 6658 (top panel) or for hypermutation at site 6589 (bottom panel) followed by gel separation and PhosphoImager quantification. The blank control represents untreated McA7777 cells. C, and D, Graphical presentation of the data obtained from three repeats as in figure 2B for editing levels at site 6658 (C) and hypermutation levels at site 6589 (D). Each bar represents the mean and standard deviation with n=3. E, Sequencing analyses of the 3D-PCR amplifications at 74°C. The 3D-PCR amplifications at 74°C were cloned and 20 clones were randomly selected for DNA sequencing. The C-to-U mutations detected in each clone are graphically presented in black by each individual clone number vs sites of nucleotide mutation. Other minor mutations are marked as follows, A/G, red; and T/C, bright blue. The graph right side numbers indicate how many C-to-U conversions are detected in the single clone.
Figure 3
Figure 3. Hypermutation of apoB mRNA in HepG2 cells induced by rat APOBEC-1 over-expression using adenovirus
Rat or human APOBEC-1 encoded in adenoviruses was expressed in HepG2 cells with or without co-expression of rat or human ACF, respectively. Total RNAs were extracted after a 3 day viral exposure. The apoB mRNA (6471–6886 nt) was amplified by RT-PCR. The PCR amplifications were cloned and 20 clones were randomly selected for DNA sequencing. The C-to-U mutations detected in each clone are graphically presented in black by each individual clone number vs sites of mutation. Other minor mutations are marked as follows, A/G, red; and T/C, bright blue. A, B, and C. ApoB mRNA hypermutation induced by rat APOBEC-1 alone (A), rat APOBEC-1 + rat ACF (B), and rat APOBEC-1-E181Q + rat ACF (C). D, E, and F. ApoB mRNA hypermutation induced by human APOBEC-1 alone (D), human APOBEC-1 + human ACF (E), and human APOBEC-1-E181Q + human ACF (F).
Figure 4
Figure 4. Cytidine deamination dinucleotide context analyses of APOBEC-1 hypermutation
APOBEC-1 hypermutation sequences obtained in Fig. 1E, 2E, and 3 were analyzed according to the 5′ immediate nucleotides of each hypermutated cytidine. The data were summarized and presented in graphs to show their dinucleotide preferences. A, Dinucleotide context analyses of rat and human APOBEC-1 hypermutation on human apoB mRNA by adenoviral expression as in HepG2 cells, Fig. 3. B, Dinucleotide context analyses of rat APOBEC-1 hypermutation on human or rat apoB mRNA by plasmid transfections as in HepG2 cells, Fig. 1E or McA7777 cells, Fig. 2E, respectively.
Fig. 5
Fig. 5. Rat APOBEC-1 hypermutation is regulated by its auxiliary cofactors
Rat or human APOBEC-1 and cofactors encoded in adenoviruses were co-expressed in HepG2 cells and total RNAs were extracted after a 2 day viral exposure. The apoB mRNA (6471–6886 nt) was amplified by RT-PCR and the apoB amplification were subjected to primer extension analyses with primers specific for sites 6493, 6655, 6702, 6845, 6639, 6802, and 6666. The resultant primer extension products were separated by 8% polyacrylamide urea gel electrophoresis and quantified using a PhosphoImager. The data obtained are summarized and graphically presented. The pe6493, etc. stands for the primer extension analyses at site 6394, etc. Each bar represents the mean and standard deviation with n=3.
Fig. 6
Fig. 6. The effect of APOBEC-1 cofactors on APOBEC-3C hypermutation
APOBEC-1 cofactors encoded in pcDNA3.2 plasmids were co-transfected with HBV and APOBEC-3C into HepG2 cells and the HBV viral genome was extracted after 72 h. The HBV x-gene was amplified by regular PCR and the resultant amplifications were analyzed by direct primer extension, 3D-PCR at different denaturing temperatures, and follow-up primer extension analyses of 3D-PCR amplifications. A and B, Direct primer extension analyses of HBV x-gene hypermutation at site 1513 in regular PCR amplifications followed by 8% polyacrylamide urea gel separation (A) and graphical presentation of the hypermutation quantification using a PhosphoImager (B). Each bar represents the mean and standard deviation with n=3. C, HBV x-gene hypermutation analyses by 3D-PCR at different denaturing temperatures followed by 1% agarose gel electrophoresis and ethidium bromide staining. D and E, Primer extension analyses of HBV x-gene hypermutation levels in 3D-PCR amplifications: 3D-PCR amplifications at 82°C and 81°C from figure 6C (lanes 1–13) were primer extended with a primer specific for site 1642. The primer extension products were separated by 8% polyacrylamide urea gel electrophoresis (D) and quantified using a PhosphoImager. The data are summarized and presented graphically (E).
Fig. 7
Fig. 7. The effect of cellular factor KSRP on APOBEC-3B hypermutation
A and B, APOBEC-3B hypermutation evaluation. KSRP was co-transfected with HBV and APOBEC-3B or its mutants into HepG2 cells and the HBV viral genome was extracted. The HBV x-gene was amplified by regular PCR and the resultant amplifications were directly analyzed by primer extension at site 1513 followed by 8% polyacrylamide urea gel separation with quantification using a PhosphoImager (A). The results from (A) are graphically presented (B). Each bar represents the mean and standard deviation with n=3. C and D, Protein interaction analyses. KSRP was co-translated with A3B, A3C, or vector control by an in vitro coupled transcription/translation system in the presence of 35S-methionine. The protein complexes formed during the in vitro translation were immuno-precipitated by an antibody against KSRP. The precipitated protein complex was separated by a 12% SDS-PAGE denaturing gel and detected by a PhosphoImager. The results were presented as co-translation content analyses (C) and immuno-precipitated (IP) complex analyses (D).

References

    1. Goila-Gaur R, Strebel K. HIV-1 Vif, APOBEC, and intrinsic immunity. Retrovirology. 2008;5:51. - PMC - PubMed
    1. Sheehy AM, Gaddis NC, Choi JD, Malim MH. Isolation of a human gene that inhibits HIV-1 infection and is suppressed by the viral Vif protein. Nature. 2002;418:646–650. - PubMed
    1. Yu Q, Konig R, Pillai S, Chiles K, Kearney M, Palmer S, Richman D, Coffin JM, Landau NR. Single-strand specificity of APOBEC3G accounts for minus-strand deamination of the HIV genome. Nat Struct Mol Biol. 2004;11:435–442. - PubMed
    1. Henriet S, Mercenne G, Bernacchi S, Paillart JC, Marquet R. Tumultuous relationship between the human immunodeficiency virus type 1 viral infectivity factor (Vif) and the human APOBEC-3G and APOBEC-3F restriction factors. Microbiol Mol Biol Rev. 2009;73:211–232. - PMC - PubMed
    1. Henry M, Guetard D, Suspene R, Rusniok C, Wain-Hobson S, Vartanian JP. Genetic editing of HBV DNA by monodomain human APOBEC3 cytidine deaminases and the recombinant nature of APOBEC3G. PLoS One. 2009;4:e4277. - PMC - PubMed

LinkOut - more resources