. 2012 Feb 24;36(2):175-87.
doi: 10.1016/j.immuni.2011.12.014. Epub 2012 Feb 9.

Interleukin-4 production by follicular helper T cells requires the conserved Il4 enhancer hypersensitivity site V

Affiliations

Interleukin-4 production by follicular helper T cells requires the conserved Il4 enhancer hypersensitivity site V

Pandurangan Vijayanand et al. Immunity. .

Abstract

Follicular helper T cells (Tfh cells) are the major producers of interleukin-4 (IL-4) in secondary lymphoid organs where humoral immune responses develop. Il4 regulation in Tfh cells appears distinct from the classical T helper 2 (Th2) cell pathway, but the underlying molecular mechanisms remain largely unknown. We found that hypersensitivity site V (HS V; also known as CNS2), a 3' enhancer in the Il4 locus, is essential for IL-4 production by Tfh cells. Mice lacking HS V display marked defects in type 2 humoral immune responses, as evidenced by abrogated IgE and sharply reduced IgG1 production in vivo. In contrast, effector Th2 cells that are involved in tissue responses were far less dependent on HS V. HS V facilitated removal of repressive chromatin marks during Th2 and Tfh cell differentiation and increased accessibility of the Il4 promoter. Thus, Tfh and Th2 cells utilize distinct but overlapping molecular mechanisms to regulate Il4, a finding with important implications for understanding the molecular basis of allergic diseases.


Figures

Figure 1
Figure 1. Cis-regulatory regions in the mouse Th2 locus and chromatin analysis of HS V-deficient T cells
(A) Diagram represents the murine Th2 cytokine locus showing locations of the DNase I hypersensitivity sites (HS) and conserved non-coding sequences (red arrows), locus control region (LCR, black arrows), Il13 and Il4 promoter (blue arrows) and species conservation tracks. (B) DNase I HS analysis of unstimulated wild type (WT) and ΔV Th2 cells (ΔV) either left unstimulated or stimulated for 6 hours with PMA and ionomycin (+6h stim) to induce HS VA. Southern blot with a 5’ IL-4 probe revealed the indicated HS sites. Double arrow shows parent BamHI fragment. Note the HS V deletion decreases the size of this band, but not HS fragments in ΔV T cells. HS V and HS VA fragments are indicated by the * and ** symbols, respectively. See also Figure S1. (C) Schematic representation of the two Il4 alleles in KN2-KN2, KN2-WT and KN2-V allelic reporter mice.
Figure 2
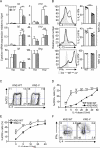
Figure 2. Cytokine gene expression profile of HS V-deficient CD4+ T cells
(A) Hprt1-normalized cytokine mRNA abundance in CD4+ T cells differentiated in vitro under Th2 and Th1 polarizing conditions for 1 week and stimulated with PMA and ionomycin for 4 hours. Bars display average and error bars indicate standard error of mean. (B) Histograms show intracellular cytokine staining of cells described in A. (C) Contour plots show IL-4 and huCD2 staining in Th2 cells generated in vitro (A). (D-E) CD4+ T cells from the indicated mice were differentiated in vitro under sub-maximal Th2 polarizing conditions. Graphs shows the percentage huCD2+ cells in relation to the concentration of exogenous IL-4 added to the culture. See also Figure S2A. (F) Contour plot shows intracellular cytokine staining of restimulated CD4+ T cells from KN2-WT and KN2-V mice cultured with 11 U/ml of IL-4. See also Figure S2B. n.s., no statistically significant difference (p>0.05), ** p<0.01, *** p<0.001 with the Student's t-test.
Figure 3
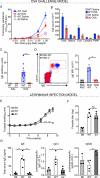
Figure 3. In vivo Th2 responses in HS V-deficient mice
Cohorts of wild type (WT) and HS V-deficient (ΔV) BALB/c mice were subjected to the ovalbumin (OVA) model of allergic airway disease. (A) Airway hyper-responsiveness following saline (n=10) and OVA challenge (n=12) was measured as increasing pulmonary resistance in response to acetylcholine (ach). Data are shown as mean ± standard error mean (SEM). (B) Total number and cellular composition of the leukocytes in bronchoalveolar lavage fluid (mean ± SEM); macrophages (Macro), eosinophils (Eos), lymphocytes (Lympho), polymorphonuclear neutrophils (PMN). (C) Serum OVA-specific IgE abundance measured by ELISA (n=12). Average (bars) of data from individual mice (filled circles) are shown; error bars are SEM. (D) Overlay of dot plots showing IgE and CD131 staining of live, singlet-gated, CD45+ cells infiltrating the lungs of OVA-challenged KN2-WT and KN2-V mice. Graph at right shows mean fluorescence intensity (MFI) of IgE staining on basophils. (E-G) Cohorts of 4 wild type C57BL/6 (B6), wild type Balb/c (WT), and HS V-deficient BALB/c (ΔV) mice were infected with Leishmania major promastigotes in the hind footpad. (E) Footpad swelling over the course of infection. (F) Footpad parasite burden (log titer) 64 days after infection. (G) ELISA measurement of total serum IgE and Leishmania freeze-thaw antigen-specific IgG1 and IgG2b. n.s., no statistically significant difference (p>0.05),* p<0.05, ** p<0.01, *** p<0.001 with the Student's t-test.
Figure 4
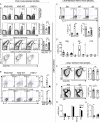
Figure 4. HS V-deficient Tfh cells fail to produce IL-4
(A) Cohorts of KN2-KN2, KN2-WT and KN2-V BALB/c mice were subjected to the ovalbumin (OVA) model of allergic airway disease. Contour plots for CD4 and huCD2 show all live and singlet-gated lymph node cells. Numbers indicate percentage of cells that are huCD2+CD4+. Contour plots for CXCR5 and PD-1 show all CD4+CD8B220 cells (third row) or only huCD2+CD4+CD8B220 cells (fourth row). Numbers indicate percentage of CXCR5+PD-1+cells; inset histograms show huCD2 staining of these cells. Bars represent the average and filled circles represent data from individual mice; error bars are SEM. (B) Contour plots show intracellular staining of cytokines in restimulated huCD2+CD4+ (top panel) and CXCR5+PD-1+ (bottom panel) lymph node cells described in A. (C) Cohorts of wild type C57BL/6 (B6), wild type BALB/c (WT), and HS V-deficient BALB/c mice (ΔV) were infected with L. major. Ten weeks later, restimulated T cells in the draining popliteal lymph nodes were analyzed by flow cytometry. Contour plots show intracellular staining of cytokines in size-gated CD4+CD8B220 cells. Data are summarized in graphs shown below. (D) Hprt1-normalized IfngIl4 and Il13 mRNA abundance in unstimulated popliteal lymph node cells from L. major infected mice. (E-F) Cohorts of WT and HS V-deficient C57BL/6 mice (n=4-10 per experiment) were infected with LCMV. Two weeks later, CD4+ T cells and B cells isolated from lymph nodes and spleen were analyzed by flow cytometry. (E) Contour plots for CXCR5 and PD-1 show size-gated CD4+CD44hiCD62LCD8B220cells. Numbers indicate percentage of CXCR5+PD-1+cells. (F) Contour plots for IgD and FAS show size-gated CD19+CD4CD8cells. Numbers indicate percentage of IgDlowFAS+cells. Summary of data from 4 independent experiments are shown in graphs at right. (G-H) Hprt1-normalized Bcl6, Blimp1, ICOS, SLAM-associated protein (SAP, encoded by Sh2d1a), Il21, Il4 and Il13 mRNA in FACS sorted pure populations of CXCR5+PD-1hi Tfh cells, freshly isolated from lymph node cells and spleen of mice described in E. n.s., no statistically significant difference (p>0.05),* p<0.05, ** p<0.01, *** p<0.001 with the Student's t-test.
Figure 5
Figure 5. HS V-deficient lymph node T cells fail to produce IL-4 early in the primary immune response
Cohorts of KN2-KN2, KN2-WT and KN2-V BALB/c mice were sensitized to ovalbumin by intraperitoneal immunization. (A) ELISA measurement of ovalbumin-specific IgE, IgG1 and IgG2b levels in serum. Bars represent the average; error bars are SEM; circles represent data from each mouse. (B) On days 4 and 7 the draining parathymic lymph node cells were stimulated in vitro with PMA, ionomycin and brefeldin A for 4 hours and analyzed by flow cytometry. Contour plots show intracellular staining of cytokines in size-gated huCD2+CD4+CD8B220 cells. Data are summarized in the bar graphs to the right. (C) Three weeks after sensitization mice were intranasally challenged with ovalbumin for three consecutive days, and T cells in the lung-draining mediastinal lymph nodes were analyzed as described in B.
Figure 6
Figure 6. HS V function in IL-4 producing cells infiltrating the lungs in a murine model of asthma
Cohorts of KN2-KN2, KN2-WT and KN2-V BALB/c mice were sensitized and challenged with ovalbumin to induce allergic airway inflammation. Lung-infiltrating cells were analyzed by flow cytometry after in vitro stimulation with PMA and ionomycin. See also Table S1. (A) Contour plots show intracellular staining of cytokines in CD4+CD3+CD8B220 cells (T cells) and CD45+IgE+CD49b+CD3MHCII cells (basophils). See also Figure S4. Graphs at right show compiled data for IL-4, IL-13, and huCD2 expression. Bars represent the average; error bars are SEM; filled circles represent data from each mouse. (B) Histograms of IL-4 and IL-13 staining in huCD2+ T cells and basophils, and IL-4 staining in IL-13+ cells as indicated. (C) Hprt1-normalized cytokine mRNA abundance in FACS-sorted CD45+CD3CD11b+MHCII CD11c Siglec F+ cells (eosinophils). See also Figure S4. n.s., no statistically significant difference (p>0.05),* p<0.05, ** p<0.01, *** p<0.001 with the Student's t-test.
Figure 7
Figure 7. Chromatin accessibility and NFAT binding in the Th2 locus of HS V deficient T cells
(A) Hprt1-normalized Il4 mRNA abundance in wild type (WT) and HS V-deficient (ΔV) naïve T cells and Th2 cells (derived in vitro) stimulated with anti-CD3 and anti-CD28 antibodies, and PMA and ionomycin, respectively, for the indicated times. Dots display average and error bars indicate standard error of mean (SEM). (B) ChIP-PCR analysis: real-time PCR quantification of Il4 promoter (IL-4p), HS VA and Ifng promoter (IFNγp) sequences following ChIP with antibody to NFAT in WT and ΔV Th2 cells and naïve T cells, either left unstimulated or stimulated for 45 minutes with PMA and ionomycin. Data are expressed as the normalized percentage of input DNA recovered and represent mean and SEM of at least 3 independent ChIP experiments. Data was normalized to the mean ChIP recovery of all experiments. Raw data from independent experiments are shown in Figure S3A and B. (C-D) Real-time PCR quantification of Il4 promoter (IL-4p), HS IV, HS VA and HS V sequences following anti-H3K4me2 (C) and anti-H3K27me3 (D) ChIP of chromatin extracts obtained from resting CD4+ naïve T cells, Th2 cells derived in vitro and Tfh cells derived in vivo from wild type (WT) and HS V-deficient (ΔV) mice. Data are expressed as the percentage of input DNA recovered and represent mean and SEM of at least 3 independent ChIP experiments. Data from anti-H3K27me3 ChIP of Tfh cells was normalized and raw data from independent experiments are shown in Figure S3C. Real-time PCR quantification of control sequences is shown in Figure S3E. See also Figure S3D and Table S2.

References

    1. Agarwal S, Avni O, Rao A. Cell-type-restricted binding of the transcription factor NFAT to a distal IL-4 enhancer in vivo. Immunity. 2000;12:643–652. - PubMed
    1. Agarwal S, Rao A. Modulation of chromatin structure regulates cytokine gene expression during T cell differentiation. Immunity. 1998;9:765–775. - PubMed
    1. Amsen D, Antov A, Jankovic D, Sher A, Radtke F, Souabni A, Busslinger M, McCright B, Gridley T, Flavell RA. Direct regulation of Gata3 expression determines the T helper differentiation potential of Notch. Immunity. 2007;27:89–99. - PMC - PubMed
    1. Amsen D, Blander JM, Lee GR, Tanigaki K, Honjo T, Flavell RA. Instruction of distinct CD4 T helper cell fates by different notch ligands on antigen-presenting cells. Cell. 2004;117:515–526. - PubMed
    1. Ansel KM, Djuretic I, Tanasa B, Rao A. Regulation of Th2 differentiation and Il4 locus accessibility. Annu Rev Immunol. 2006;24:607–656. - PubMed

Publication types

MeSH terms