. 2012 Mar;122(3):935-47.
doi: 10.1172/JCI46465. Epub 2012 Feb 13.

The intersection of genetic and chemical genomic screens identifies GSK-3α as a target in human acute myeloid leukemia

Affiliations

The intersection of genetic and chemical genomic screens identifies GSK-3α as a target in human acute myeloid leukemia

Versha Banerji et al. J Clin Invest. 2012 Mar.

Abstract

Acute myeloid leukemia (AML) is the most common form of acute leukemia in adults. Long-term survival of patients with AML has changed little over the past decade, necessitating the identification and validation of new AML targets. Integration of genomic approaches with small-molecule and genetically based high-throughput screening holds the promise of improved discovery of candidate targets for cancer therapy. Here, we identified a role for glycogen synthase kinase 3α (GSK-3α) in AML by performing 2 independent small-molecule library screens and an shRNA screen for perturbations that induced a differentiation expression signature in AML cells. GSK-3 is a serine-threonine kinase involved in diverse cellular processes, including differentiation, signal transduction, cell cycle regulation, and proliferation. We demonstrated that specific loss of GSK-3α induced differentiation in AML by multiple measurements, including induction of gene expression signatures, morphological changes, and cell surface markers consistent with myeloid maturation. GSK-3α-specific suppression also led to impaired growth and proliferation in vitro, induction of apoptosis, loss of colony formation in methylcellulose, and anti-AML activity in vivo. Although the role of GSK-3β has been well studied in cancer development, these studies support a role for GSK-3α in AML.


Figures

Figure 1
Figure 1. Three expression-based screens identify GSK-3α as a target of AML differentiation.
We performed 3 independent GE-HTS differentiation screens: (a) a bioactive small-molecule library screen in HL-60 cells, (b) a kinome-focused shRNA library screen in U937 and HL-60 cells, and (c) a kinase inhibitor-focused small-molecule library screen in U937 and HL-60 cells. Perturbations were scored by consensus classification with 5 algorithms: summed score, weighted summed score, naive Bayes, K-nearest neighbor, and support vector machine. A compound or an shRNA was considered a hit if it was classified as differentiated by all 5 methods. For the bioactive screen, each compound was screened at 1 dose. 3,232 compounds did not score across any of the 5 scoring metrics. The number of compounds scoring is indicated above each histogram bar. In the shRNA screen, the fraction of hairpins that scored for each gene is depicted. For the kinase inhibitor small-molecule screen, compounds were pinned at multiple concentrations. The number of chemical wells scoring across the number of indicated scoring algorithms is depicted. Four GSK-3 inhibitors scored across all 5 methods. The number of doses that scored is indicated in parentheses. GSK-3b i I, GSK-3b Inhibitor I; GSK-3b i VI, GSK-3b Inhibitor VI.
Figure 2
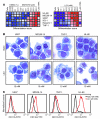
Figure 2. Pan-GSK-3 inhibition induces AML differentiation in cell lines in vitro.
(A) AML cell lines were treated with SB216763 versus DMSO and LiCl versus NaCl for 3 days. The differentiation score (summed score), as determined using the GE-HTS assay, is depicted. 1 μM ATRA was used as the positive control. Red indicates signature induction. (B) May-Grunwald Giemsa staining of AML cell lines after 3 days of LiCl treatment demonstrates cellular differentiation compared with that in NaCl-treated controls. Images were acquired by light microscopy under oil with an Olympus BX41 microscope and Q-capture software (original magnification, ×1,000). (C) Histograms depicting an increase in CD11b staining by flow cytometry with 20 mM LiCl versus 20 mM NaCl after 5 days of treatment.
Figure 3
Figure 3. Pan-GSK-3 inhibition induces AML differentiation in primary patient blasts in vitro.
(A) Histograms depicting the differentiation score (summed score) for 7 primary patient samples treated in vitro for 3 days with LiCl. Error bars represent the mean ± SD of 5 replicates. *P < 0.05, **P < 0.01, ***P < 0.001 by 1-way ANOVA using Tukey’s multiple comparison test. (B) May-Grunwald Giemsa staining of primary patient blasts at day 3 after treatment with LiCl demonstrates monocyte/macrophage-like cellular differentiation compared with that in the NaCl-treated controls. Images were acquired by light microscopy under oil with an Olympus BX41 microscope and Q-capture software (original magnification, ×1,000). No cytospins were available for patient 2.
Figure 4
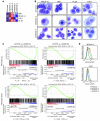
Figure 4. Loss of GSK-3α in AML induces differentiation in vitro.
(A) Isoform-specific GSK-3–directed shRNAs or a control shRNA were introduced into 4 AML cell lines, and the differentiation score (summed score) was determined using the GE-HTS assay. Red indicates induction of the differentiation score. (B) Morphology was evaluated 7 days after infection with May-Grunwald Giemsa staining of cytospin preparations. Images were acquired by light microscopy under oil with an Olympus BX41 microscope and Q-capture software (original magnification, ×1,000). (C) Four AML cell lines were profiled on Affymetrix expression arrays with shRNAs directed against GSK-3α or GSK-3β in comparison to a scrambled control shRNA (shCTRL), and GSEA was performed. Enrichment plots are shown for GSK-3α and GSK-3β knockdown in gene sets associated with monocyte maturation. FDR, false discovery rate; Monocyte up, upregulated in monocytes; Monocyte down, downregulated in monocytes. (D) Loss of GSK-3α leads to an increase in CD11b expression by flow cytometry 6 days after infection.
Figure 5
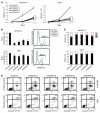
Figure 5. Phenotypic alterations associated with GSK-3α loss in MOLM-14 and U937 cells.
(A) Cell number, as measured by trypan blue exclusion. Shown are the mean ± SD of 3 replicates. *P < 0.001 by 2-way repeated-measures ANOVA, with a Bonferroni post-hoc test comparing each shRNA to the shControl. The effects of GSK-3α suppression on (B) BrdU incorporation, (C) cell cycle, and (D) apoptosis are depicted. In B, the mean ± SD of 3 biological replicates is shown on the left, and a representative experiment is shown on the right. *P < 0.001 by 1-way ANOVA with Tukey’s multiple comparison test. In C and D, representative experiments of 2 biological replicates are shown. In D, numbers represent percentages of cells in each quadrant.
Figure 6
Figure 6. Isoform-specific loss of GSK-3 impairs colony formation in methylcellulose.
(A) AML cell lines were infected with isoform-specific GSK-3–directed shRNAs or a control shRNA and plated in methylcellulose. The graph illustrates the relative number of colonies as a ratio to that in shControl. Data represent mean ± SD of 2 biological replicates. *P < 0.01, #P < 0.001 by 1-way ANOVA using Tukey’s multiple comparison test. (B) In MOLM-14 cells, overexpression of a GSK-3α cDNA immune to the effects of the 3′ UTR–directed hairpin shGSK3A_6 rescues the colony formation phenotype caused by GSK-3α knockdown. Data represent mean ± SD of 2 biological replicates. Significance was calculated by Student’s t test. The immunoblot demonstrates GSK-3α overexpression and loss of the endogenous protein with shGSK3A_6.
Figure 7
Figure 7. GSK-3α loss has anti-AML activity in vivo.
(A) U937-LucNeo cells infected with pLKO.1 vectors against GSK-3α (shGSK3A_5) and lacZ (shControl_2) were injected on day 0. Bioluminescence was quantified as a measure of disease burden. Data are represented as mean ± SEM of 6 mice per cohort. ***P < 0.001 by 2-way repeated-measures ANOVA, with a Bonferroni post-hoc test comparing shGSK3A_5 with shControl_2. (B) Spleen weights were measured on day 20 after injection. There were 5 mice in the shControl_2 cohort and 6 mice in the shGSK3A_5 cohort. Each symbol represents an individual mouse, and horizontal bars represent mean values. **P < 0.01 by Student’s t test. (C) U937-LucNeo cells infected with pLKO.1 vectors against GSK-3α (shGSK3A_8 and shGSK3A_9) and lacZ (shControl_2) were injected on day 0. Bioluminescence was quantified as a measure of disease burden. Data are represented as mean ± SEM of 6 mice per cohort. **P < 0.01, ***P < 0.001 by 2-way repeated-measures ANOVA, with a Bonferroni post-hoc test comparing each shRNA to shControl_2. (D) Survival is shown for mice engrafted with U937-LucNeo cells infected with pLKO.1 vectors against GSK-3α (shGSK3A_6), GSK-3β (shGSK3B_1), and lacZ (shControl_2). Mice were engrafted on day 0. There were 6 mice in each cohort, with statistical significance calculated by log-rank test. *P < 0.05, shGSK3A_6 survival curve relative to shControl_2 survival curve.

References

    1. Abdel-Wahab O, Levine RL. Recent advances in the treatment of acute myeloid leukemia. F1000 Med Rep. 2010;2:55. - PMC - PubMed
    1. Rubnitz JE, Gibson B, Smith FO. Acute myeloid leukemia. Hematol Oncol Clin North Am. 2010;24(1):35–63. - PubMed
    1. Dohner H, et al. Diagnosis and management of acute myeloid leukemia in adults: recommendations from an international expert panel, on behalf of the European LeukemiaNet. Blood. 2010;115(3):453–474. doi: 10.1182/blood-2009-07-235358. - DOI - PubMed
    1. Ley TJ, et al. DNMT3A mutations in acute myeloid leukemia. N Engl J Med. 2010;363(25):2424–2433. doi: 10.1056/NEJMoa1005143. - DOI - PMC - PubMed
    1. Mardis ER, et al. Recurring mutations found by sequencing an acute myeloid leukemia genome. . N Engl J Med. 2009;361(11):1058–1066. doi: 10.1056/NEJMoa0903840. - DOI - PMC - PubMed

Publication types

Substances