Comparative Study
. 2012 Mar;9(2):163-74.
doi: 10.1038/cmi.2011.61. Epub 2012 Feb 13.

Lymphocyte phenotypes in wild-caught rats suggest potential mechanisms underlying increased immune sensitivity in post-industrial environments

Affiliations
Comparative Study

Lymphocyte phenotypes in wild-caught rats suggest potential mechanisms underlying increased immune sensitivity in post-industrial environments

Ashley M Trama et al. Cell Mol Immunol. 2012 Mar.

Abstract

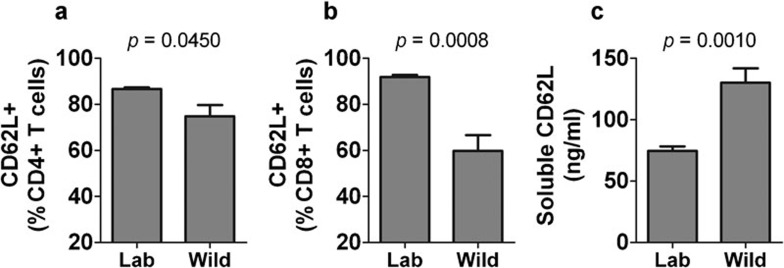
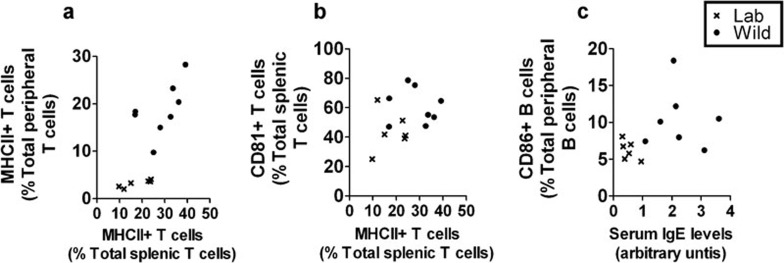
The immune systems of wild rats and of laboratory rats can been utilized as models of the human immune system in pre-industrial and post-industrial societies, respectively. In this study, lymphocyte phenotypes in wild rats were broadly characterized, and the results were compared to those obtained by us and by others using cells derived from various strains of laboratory rats. Although not expected, the production of regulatory T cells was not apparently different in wild rats compared to laboratory rats. On the other hand, differences in expression of markers involved in complement regulation, adhesion, signaling and maturation suggest increased complement regulation and decreased sensitivity in wild-caught rats compared to laboratory rats, and point toward complex differences between the maturation of T cells. The results potentially lend insight into the pathogenesis of post-industrial epidemics of allergy and autoimmune disease.


Figures

Figure 1
Figure 1
Representative flow cytometric profiles showing staining of peripheral T cells derived from laboratory and wild rats.
Figure 2
Figure 2
The presence of regulatory T cells in the periphery of laboratory and wild rats. The percentage of CD4+ T cells that are (a) FoxP3+, CD25+ (b) CD25+ alone, and (c) CD134+ are shown. The mean values (bar) and standard errors are shown. NS, not significant.
Figure 3
Figure 3
The distribution of CD62L (L-selectin) in laboratory and wild rats. The percentage of positive cells on peripheral T cells was determined by flow cytometry (a and b), and the concentration of soluble ligand in the serum (c) was determined using a multiplex assay as described in the section on ‘Materials and methods'. The mean values (bar) and standard errors are shown.
Figure 4
Figure 4
Maturation markers on peripheral T cells in laboratory and wild rats. Maturation markers included (a) coexpression of CD4 and CD8 on T cells, (b) CD90 on CD4+ T cells, and (c) CD90 and (d) CD59 on CD8+ T cells. The percentage of positive cells was determined by flow cytometry as described in the section on ‘Materials and methods'. The mean values (bar) and standard errors are shown. NS, not significant.
Figure 5
Figure 5
Thymocyte phenotypes in laboratory and wild rats. Thymocytes were separated into those expressing (a) high and (b) low levels of CD90. The percent of (c) CD4+, (d) CD8+, (e) CD4, CD8 double positive, and (f) CD4, CD8 double negative thymocytes expressing CD25 is also shown. The percentage of positive cells was determined by flow cytometry as described in the section on ‘Materials and methods'. The mean values (bar) and standard errors are shown. NS, not significant.
Figure 6
Figure 6
Markers of B-cell/T-cell interactions on peripheral and splenic lymphocytes from laboratory and wild rats. Levels of (a) CD28 on T cells, (b and e) CD81 on T and B cells, (c and f) CD86 on T and B cells, and (d) MHCII on T cells are shown. The percentage of positive cells was determined by flow cytometry as described in the section on ‘Materials and methods'. The mean values (bar) and standard errors are shown. NS, not significant.
Figure 7
Figure 7
Heterogeneity in the level of immune activation in wild rats as indicated by a lack of correlation between various markers. Although the expression of a number of markers was different between wild and laboratory rats, a lack of correlation between some of the same markers in the wild rat population was noted. Some examples are shown as follows: (a) MHC II expression in the spleen and in the periphery, (b) CD81 and MHC II expression on splenic T cells and (c) CD86 expression on peripheral B cells and serum IgE levels.

References

    1. Borkow G, Leng Q, Weisman Z, Stein M, Galai N, Kalinkovich A, et al. Chronic immune activation associated with intestinal helminth infections results in impaired signal transduction and anergy. J Clin Invest. 2000;106:1053–1060. - PMC - PubMed
    1. Worldwide variation in prevalence of symptoms of asthma. allergic rhinoconjunctivitis. atopic eczema: ISAAC The International Study of Asthma and Allergies in Childhood (ISAAC) Steering Committee.[see comment] Lancet. 2005;351:1225–1232. - PubMed
    1. Onkamo P, Vaananen S, Karvonen M, Tuomilehto J. Worldwide increase in incidence of Type I diabetes—the analysis of the data on published incidence trends. Diabetologia. 1999;42:1395–1403. - PubMed
    1. Black P. Why is the prevalence of allergy and autoimmunity increasing. Trends Immunol. 2001;22:354–355. - PubMed
    1. Gergen PJ, Turkeltaub PC, Kovar MG. The prevalence of allergic skin test reactivity to eight common aeroallergens in the U.S. population: results from the second National Health and Nutrition Examination Survey. J Allergy Clin Immunol. 1987;80:669–679. - PubMed

Publication types