Randomized Controlled Trial
. 2012 Feb 12;15(4):636-43.
doi: 10.1038/nn.3046.

The integration of motion and disparity cues to depth in dorsal visual cortex

Affiliations
Randomized Controlled Trial

The integration of motion and disparity cues to depth in dorsal visual cortex

Hiroshi Ban et al. Nat Neurosci. .

Abstract

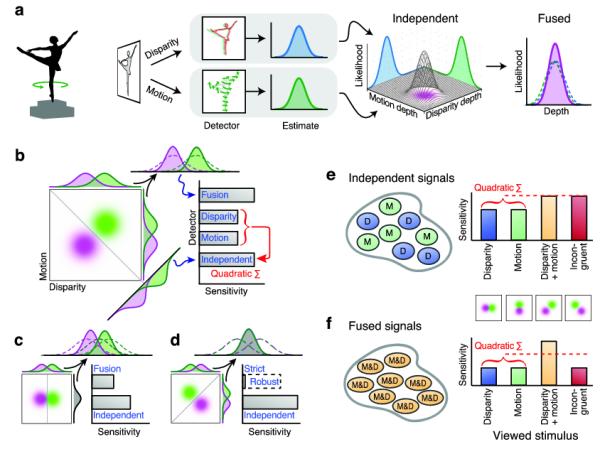
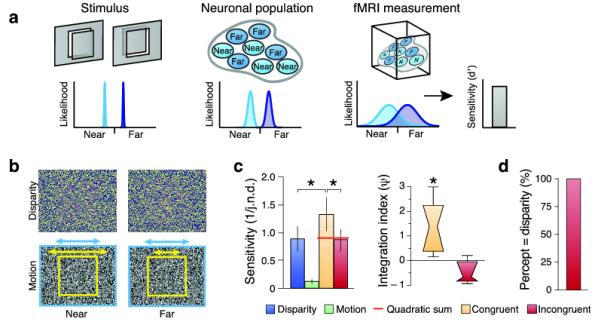
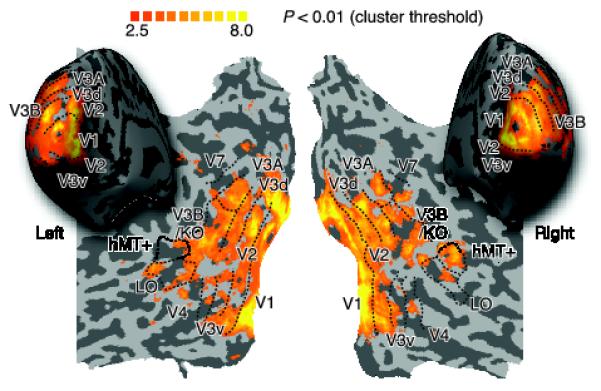
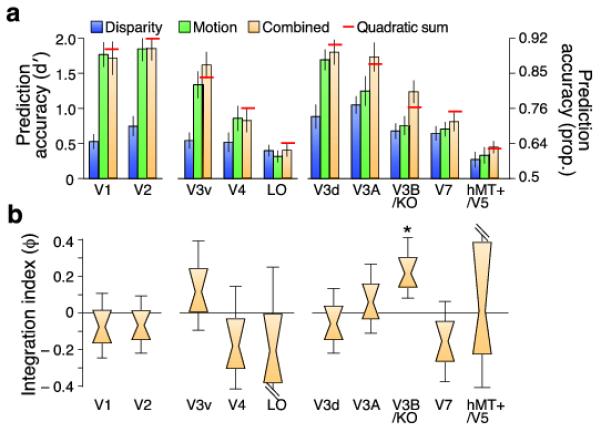
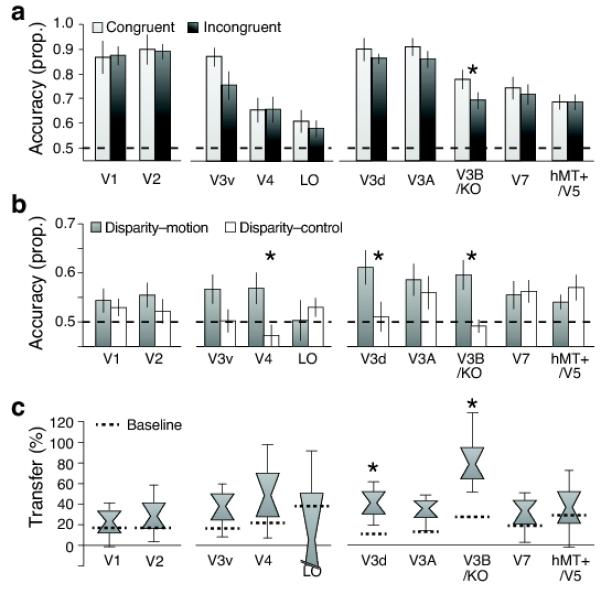
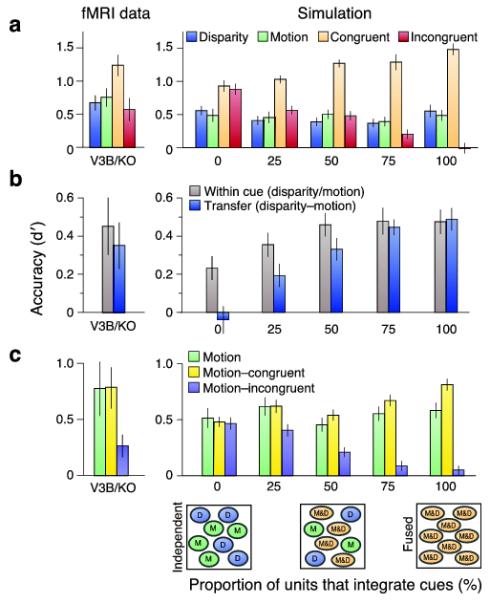
Humans exploit a range of visual depth cues to estimate three-dimensional structure. For example, the slant of a nearby tabletop can be judged by combining information from binocular disparity, texture and perspective. Behavioral tests show humans combine cues near-optimally, a feat that could depend on discriminating the outputs from cue-specific mechanisms or on fusing signals into a common representation. Although fusion is computationally attractive, it poses a substantial challenge, requiring the integration of quantitatively different signals. We used functional magnetic resonance imaging (fMRI) to provide evidence that dorsal visual area V3B/KO meets this challenge. Specifically, we found that fMRI responses are more discriminable when two cues (binocular disparity and relative motion) concurrently signal depth, and that information provided by one cue is diagnostic of depth indicated by the other. This suggests a cortical node important when perceiving depth, and highlights computations based on fusion in the dorsal stream.


Figures

Figure 1
Figure 1
A. Cartoon of depth processing: depth of the ballerina figurine is estimated from disparity and motion, producing a bivariate Gaussian (3D plot with purple blob). Fusion combines disparity and motion using maximum likelihood estimation, producing a univariate ‘depth’ estimate. B. Discriminating two shapes (‘Margot’ vs. ‘Darcy’) defined by bivariate Gaussians (purple and green blobs). We envisage four types of detector: ‘disparity’ and ‘motion’ respond to only one dimension (i.e. discrimination of the marginals); the ‘independent’ detector uses the optimal separating plane (grey line on the negative diagonal); the ‘fusion’ detector integrates cues. C. ‘Single’ cue case: shapes differ in disparity but motion is the same. The optimal separating plane is now vertical (independent detector), while the fusion mechanism is compromised. D. Incongruent cues: disparity and motion indicate opposite depths. Independent performance matches Fig 1b while fusion is illustrated for two scenarios: strict (detector is insensitive) and robust (dotted bar – performance reverts to one component). E. Predicted measurements of independent units. Four types of stimuli are displayed: ‘disparity’ (Fig 1c), ‘motion’ (motion indicates a depth difference, disparity specifies the same depth), ‘Disparity+motion’ (Fig 1b), and ‘incongruent’ (Fig 1d). F. Predicted measurements of fused units. Note that performance in the Motion and Disparity conditions is lower than in panel e.
Figure 2
Figure 2
A. Cartoon of the decoding approach. Participants view stimuli that depict ‘near’ or ‘far’ depths. These differentially excite neuronal populations within an area of cortex. fMRI measurements reduce the resolution. We characterize the sensitivity of the decoding algorithm in discriminating near and far stimuli. B. Illustrations of disparity and motion defined depth stimuli. The top row provides stereograms to be viewed through red-green anaglyphs. The bottom row provides a cartoon of the relative motion stimuli: yellow arrow speed of target, blue arrow speed of background. C. Behavioural tests of integration. Data show observers’ mean sensitivity (N=7) with the between-subjects SEM. The red horiztonal line indcates the quadratic summation prediction. The adjacent plot shows the results as an integration index for the congruent and incongruent conditions. A value of zero indicates the minimum bound for fusion. Data are presented as notched distribution plots. The center of the ‘bow tie’ represents the median, the edges depict 68% confidence values, and the upper and lower error bars 95% confidence intervals. D. The results of an experiment in which observers (N=4) reported whether the stimulus was near or far in the incongruent cue stimulus. Data are expressed as the percentage of trials on which reported depth matched depth from disparity.
Figure 3
Figure 3
Representative flatmaps showing the left and right visual regions of interest from one participant. The maps show the location of retinotopic areas, V3B/KO, the human motion complex (hMT+/V5) and the lateral occipital (LO) area. Regions were defined using independent localizers. Sulci are coded in darker gray than the gyri. Superimposed on the maps are the results of a group searchlight classifier analysis that moved itteratively throughout the entire volume of cortex measured, discriminating between ‘near’ and ‘far’ depth positions. The colour code represents the t-value of the classification accuracies obtained. This analysis confirmed that we had not missed any important areas outside those localized independently.
Figure 4
Figure 4
A. Prediction accuracy for near vs. far discrimination in different regions of interest. The red lines illustrate the accuracy expected from the quadratic summation of discriminabilities for the ‘single’ cue conditions. Error bars depict the SEM. B. Results as an integration index. A value of zero indicates the minimum bound for fusion (i.e. the prediction based on quadratic summation). Data are presented as notched distribution plots. The center of the ‘bow tie’ represents the median, the grey-shaded area depicts 68% confidence values, and the upper and lower error bars 95% confidence intervals.
Figure 5
Figure 5
A. Prediction accuracy for near vs. far classification when cues are congruent (Fig. 1b) or incongruent (Fig. 1d). Error bars show SEM. The dotted horizontal line at 0.5 corresponds to chance performance for this binary classification. B. Prediction accuracy for the cross-cue transfer analysis. Two types of transfer are depicted: between moiton and disparity (gray bars) and between disparity and a flat motion control stimulus (white bars). Classification accuracies are generally lower than for the standard SVM analysis (Fig. 4a); this is not surprising given the considerable differences between the stimuli that evoked the training and test fMRI responses. Error bars show SEM. C. Data shown as a transfer index. A value of 100% would indicate that prediction accuracies were equivalent for within- and between- cue testing. Distribution plots show the median, 68% and 95% confidence intervals. Dotted horizontal lines depcit a bootstrapped chance baseline based on the upper 95th centile for transfer obtained with randomly permutted data.
Figure 6
Figure 6
A. fMRI decoding data from V3B/KO adjacent to the simulation results. Simulation results show decoding performance of a simulated population of voxels where the neuronal population contains different percentages of units tuned to individual vs. fused cues. The χ2 statistic was used to identify the closest fit between empirical and simulated data from a range of popoulation mixtures. Error bars depecit SEM. B. fMRI decoding data for the transfer tests adjacent to the simulation results. Error bars depecit SEM. C. Performance in a transfer test between data from the motion condition and the consistent and inconsistent cue conditions. Error bars depecit SEM.

References

    1. Dosher BA, Sperling G, Wurst SA. Tradeoffs between stereopsis and proximity luminance covariance as determinants of perceived 3D structure. Vision Res. 1986;26:973–990. - PubMed
    1. Buelthoff HH, Mallot HA. Integration of Depth Modules - Stereo and Shading. Journal of the Optical Society of America a-Optics Image Science and Vision. 1988;5:1749–1758. - PubMed
    1. Landy MS, Maloney LT, Johnston EB, Young M. Measurement and Modeling of Depth Cue Combination - in Defense of Weak Fusion. Vision Research. 1995;35:389–412. - PubMed
    1. Clark JJ, Yuille AL. Data fusion for sensory information processing systems. Kluwer Academic; 1990.
    1. Ernst MO, Banks MS. Humans integrate visual and haptic information in a statistically optimal fashion. Nature. 2002;415:429–433. - PubMed

Publication types