Comparative Study
. 2012 May;32(5):1236-45.
doi: 10.1161/ATVBAHA.111.244525. Epub 2012 Feb 9.

NOX4 pathway as a source of selective insulin resistance and responsiveness

Affiliations
Comparative Study

NOX4 pathway as a source of selective insulin resistance and responsiveness

Xiangdong Wu et al. Arterioscler Thromb Vasc Biol. 2012 May.

Abstract

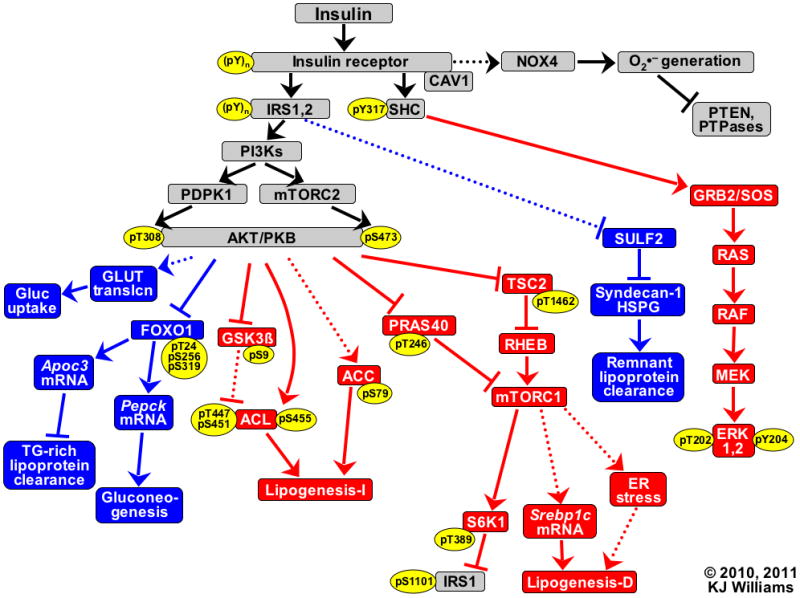
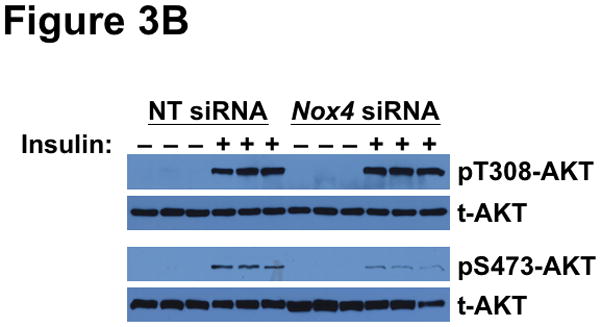
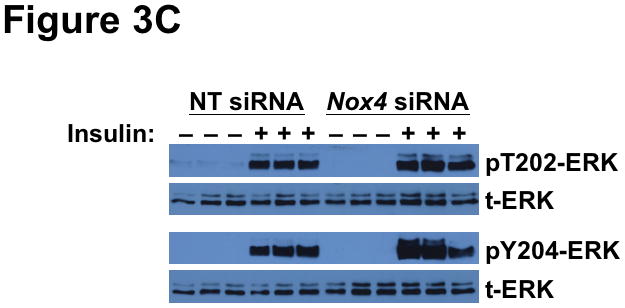
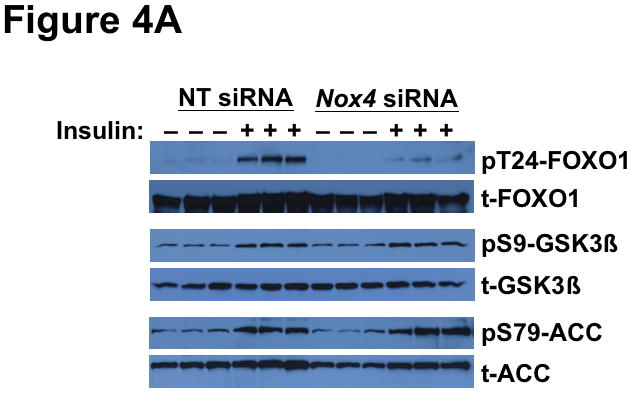
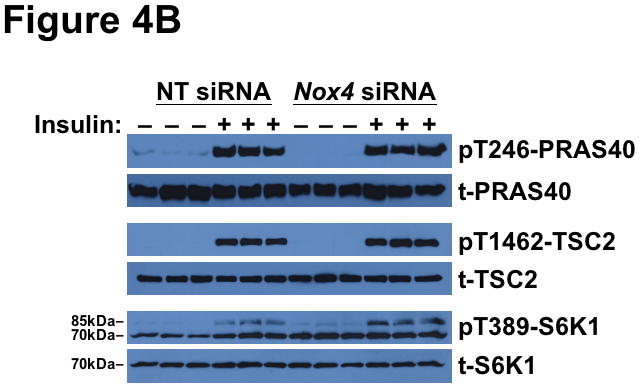
Objective: Type 2 diabetes mellitus and related syndromes exhibit a deadly triad of dyslipoproteinemia, which leads to atherosclerosis; hyperglycemia, which causes microvascular disease; and hypertension. These features share a common, but unexplained, origin-namely, pathway-selective insulin resistance and responsiveness. Here, we undertook a comprehensive characterization of pathway-selective insulin resistance and responsiveness in liver and hepatocytes by examining 18 downstream targets of the insulin receptor, surveying the AKT, ERK, and NAD(P)H oxidase 4 pathways.

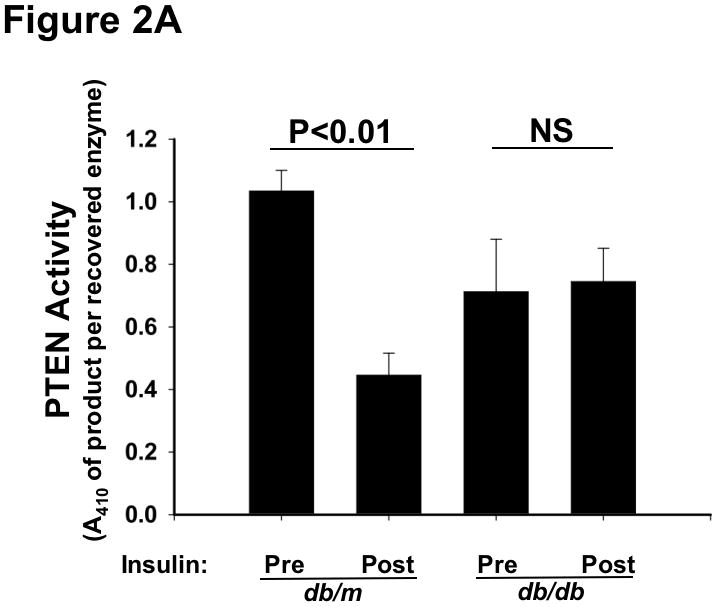
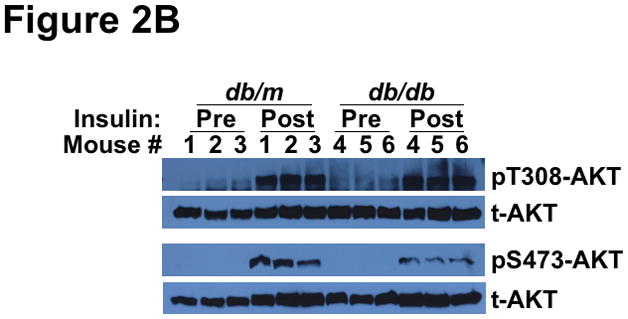
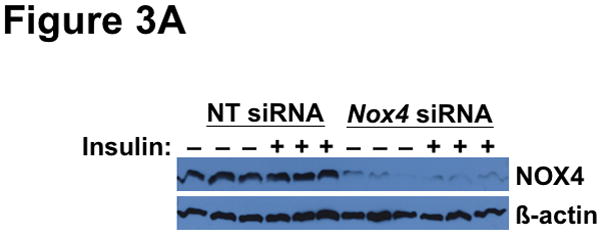
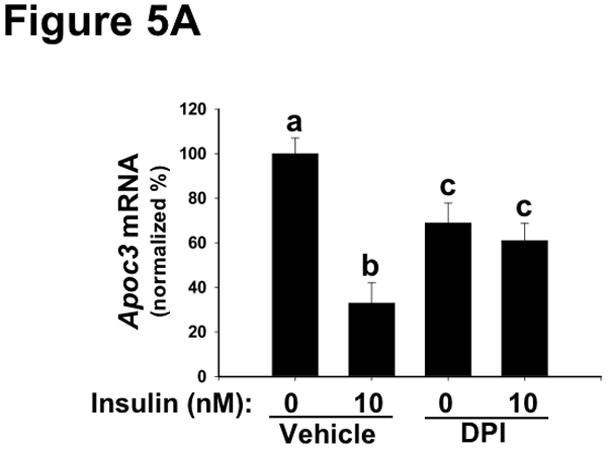
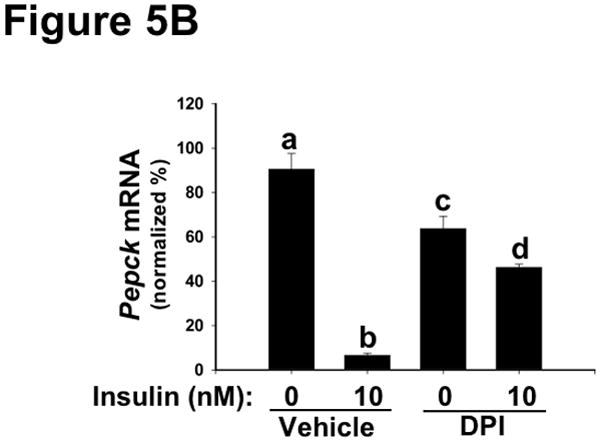
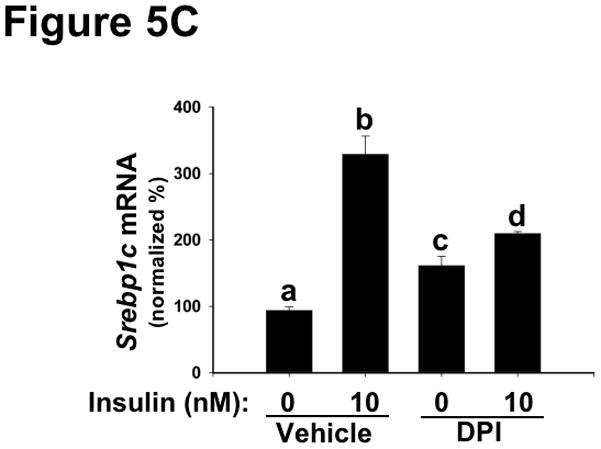
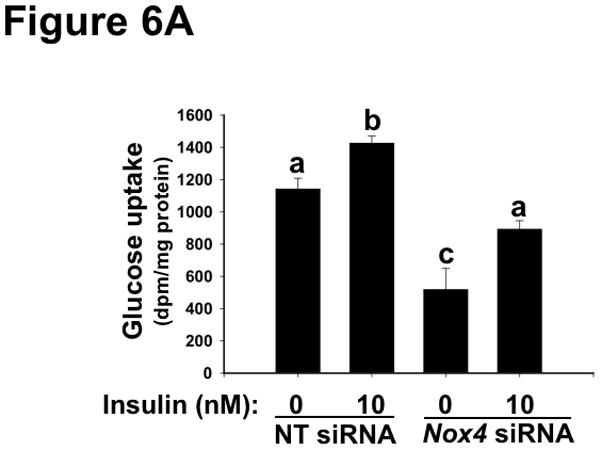
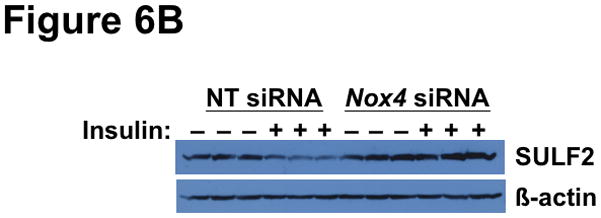
Methods and results: Injection of insulin into hyperphagic, obese type 2 diabetic db/db mice failed to inactivate hepatic protein tyrosine phosphatase gene family members, a crucial action of NAD(P)H oxidase 4 previously thought to be required for all signaling through AKT and ERK. Insulin-stimulated type 2 diabetic livers unexpectedly produced an unusual form of AKT that was phosphorylated at Thr308 (pT308), with only weak insulin-stimulated phosphorylation at Ser473. Remarkably, knockdown or inhibition of NAD(P)H oxidase 4 in cultured hepatocytes recapitulated the entire complicated pattern of pathway-selective insulin resistance and responsiveness seen in vivo-namely, monophosphorylated pT308-AKT, impaired insulin-stimulated pathways for lowering plasma lipids and glucose, but continued lipogenic pathways and robust ERK activation.

Conclusions: Functional disturbance of a single molecule, NAD(P)H oxidase 4, is sufficient to induce the key harmful features of deranged insulin signaling in type 2 diabetes mellitus, obesity, and other conditions associated with hyperinsulinemia and pathway-selective insulin resistance and responsiveness.


Conflict of interest statement

Disclosure

No conflicts of interest to report (XW, KJW).

Figures

Figure 1
Figure 1
Key branches of the insulin signaling cascade. Hypolipidemic and hypoglycemic pathways that are normally triggered by insulin are indicated in blue, whereas insulin-stimulated pathways that activate lipogenesis and MAP kinases are shown in red. Solid lines represent recognized pathways; dotted lines are less well-characterized or putative. Pointed arrowheads indicate stimulation of the immediately downstream molecule or process; flat arrowheads indicate inhibition. Thus, endpoints that receive signals from the insulin receptor via pathways with an even number of flat arrowheads (0 or 2) are activated by insulin (Gluc uptake, TG-rich lipoprotein clearance, both mechanisms for Lipogenesis, Remnant lipoprotein clearance, and phosphorylations of ERK). Pathways with an odd number of flat arrowheads are inhibited by insulin (PTEN, PTPases, and Gluconeogenesis). Specific sites that become phosphorylated (p) upon insulin stimulation are indicated within yellow ovals, and numbers indicate residues in human sequences. Lipogenesis-I refers to lipogenesis that becomes activated independently from new protein synthesis; Lipogenesis-D depends on new protein synthesis. Abbreviations: ACC, acetyl-CoA carboxylase-1; ACL, ATP citrate lyase; AKT/PKB, protein kinase B; Apoc3, apolipoprotein C-III; CAV1, caveolin-1; ER, endoplasmic reticulum; ERK, extracellular signal-regulated kinase; FOXO1, forkhead box O1A; Gluc, glucose; GLUT translcn, translocation of facilitated glucose transporters; GRB2, growth factor receptor-binding protein 2; GSK3β, glycogen synthase kinase 3β; HSPG, heparan sulfate proteoglycan; IRS, insulin receptor substrate; MEK, MAP/ERK kinase; mTORC, mammalian target of rapamycin complex; NOX4, NAD(P)H oxidase 4; PDPK1, 3′-phosphoinositide-dependent protein kinase 1; Pepck, phosphoenolpyruvate carboxykinase 1; PI3Ks, isoforms of phosphatidylinositol 3′-kinase; PRAS40, proline-rich AKT substrate of 40kDa; PTEN, phosphatase and tensin homolog deleted on chromosome 10; PTPases, protein-tyrosine phosphatases such as PTP1B; RAF, v-raf-1 murine leukemia viral oncogene homolog 1; RAS, rat sarcoma guanosine-nucleotide-binding protein; RHEB, RAS homolog enriched in brain; S6K1, ribosomal protein S6 kinase 1; SHC, Src homologous and collagen-like protein; SOS1, son of sevenless (Drosophila) homolog 1; Srebp1c, sterol regulatory element-binding protein-1c, which its discoverers originally named adipocyte determination- and differentiation-dependent factor 1 (ADD1); SULF2, heparan sulfate glucosamine-6-O-endosulfatase-2; TG, triglyceride; TSC2, tuberin.
Figure 2
Figure 2
Type 2 diabetes renders the liver unable to inactivate PTEN in response to insulin, yet still able to phosphorylate AKT at Thr308. Liver samples were obtained just before (Pre) and 10min after (Post) an intravenous injection of insulin into 14-week-old lean db/m mice (controls) and their hyperphagic, obese T2DM db/db littermates, as indicated. Other nomenclature follows Figure 1. Panel A: PTEN activities in liver homogenates, assayed under strictly anaerobic conditions (mean±SEM, n=3). Statistical comparisons by the paired t-test are indicated. Panel B: Phosphorylation of AKT at Thr308 (pT308-AKT, upper immunoblots) and Ser473 (pS473-AKT, lower immunoblots). Immunoblots for total AKT (t-AKT, meaning phosphorylated plus unphosphorylated forms) is also shown for each sample. Numbers over the lanes refer to individual animals.
Figure 2
Figure 2
Type 2 diabetes renders the liver unable to inactivate PTEN in response to insulin, yet still able to phosphorylate AKT at Thr308. Liver samples were obtained just before (Pre) and 10min after (Post) an intravenous injection of insulin into 14-week-old lean db/m mice (controls) and their hyperphagic, obese T2DM db/db littermates, as indicated. Other nomenclature follows Figure 1. Panel A: PTEN activities in liver homogenates, assayed under strictly anaerobic conditions (mean±SEM, n=3). Statistical comparisons by the paired t-test are indicated. Panel B: Phosphorylation of AKT at Thr308 (pT308-AKT, upper immunoblots) and Ser473 (pS473-AKT, lower immunoblots). Immunoblots for total AKT (t-AKT, meaning phosphorylated plus unphosphorylated forms) is also shown for each sample. Numbers over the lanes refer to individual animals.
Figure 3
Figure 3
Deficiency of NOX4 in cultured liver cells mimics the effects of type 2 diabetes on the two canonical mediators of insulin signaling, AKT and ERK. As indicated, McArdle hepatocytes were pretreated with nontarget (NT) control siRNA or Nox4 siRNA, exposed to 0 or 10nM insulin for 10 min, and then harvested. This figure displays immunoblots in triplicate from a single set of cultured cells. Each lane represents a separate culture well. Panel A: Anti-NOX4 immunoblot. Panel B: Insulin-stimulated phosphorylations of AKT (pT308-AKT, pS473-AKT, and total AKT). Panel C: Insulin-stimulated phosphorylations of ERK (pT202-ERK, pY204-ERK, and total ERK). The data from these cultured cells are representative of a total of three independent insulin signaling experiments.
Figure 3
Figure 3
Deficiency of NOX4 in cultured liver cells mimics the effects of type 2 diabetes on the two canonical mediators of insulin signaling, AKT and ERK. As indicated, McArdle hepatocytes were pretreated with nontarget (NT) control siRNA or Nox4 siRNA, exposed to 0 or 10nM insulin for 10 min, and then harvested. This figure displays immunoblots in triplicate from a single set of cultured cells. Each lane represents a separate culture well. Panel A: Anti-NOX4 immunoblot. Panel B: Insulin-stimulated phosphorylations of AKT (pT308-AKT, pS473-AKT, and total AKT). Panel C: Insulin-stimulated phosphorylations of ERK (pT202-ERK, pY204-ERK, and total ERK). The data from these cultured cells are representative of a total of three independent insulin signaling experiments.
Figure 4
Figure 4
Deficiency of NOX4 in cultured liver cells mimics the effects of type 2 diabetes on phosphorylations downstream of AKT, thereby rendering hypolipidemic and hypoglycemic pathways resistant to insulin, while leaving lipogenic pathways insulin-responsive. Displayed are immunoblots from the same single set of cultured McArdle hepatocytes as in Figure 3. Panel A: Resistance of FOXO1 to insulin-stimulated phosphorylation in NOX4-deficient hepatocytes (TG-rich lipoprotein clearance and Gluconeogenesis pathways from Figure 1), yet continued responsiveness of GSK3β and ACC (Lipogenesis-I pathway from Figure 1). Panel B: Continued activation of molecules upstream (PRAS40, TSC2) and downstream (S6K1) of mTORC1 in NOX4-deficient hepatocytes (Lipogenesis-D pathway from Figure 1). Both the 70- and 85-kDa isoforms of S6K1 can be seen on the immunblot for pT389-S6K1, as indicated. The data from these cultured cells are representative of a total of three independent experiments.
Figure 4
Figure 4
Deficiency of NOX4 in cultured liver cells mimics the effects of type 2 diabetes on phosphorylations downstream of AKT, thereby rendering hypolipidemic and hypoglycemic pathways resistant to insulin, while leaving lipogenic pathways insulin-responsive. Displayed are immunoblots from the same single set of cultured McArdle hepatocytes as in Figure 3. Panel A: Resistance of FOXO1 to insulin-stimulated phosphorylation in NOX4-deficient hepatocytes (TG-rich lipoprotein clearance and Gluconeogenesis pathways from Figure 1), yet continued responsiveness of GSK3β and ACC (Lipogenesis-I pathway from Figure 1). Panel B: Continued activation of molecules upstream (PRAS40, TSC2) and downstream (S6K1) of mTORC1 in NOX4-deficient hepatocytes (Lipogenesis-D pathway from Figure 1). Both the 70- and 85-kDa isoforms of S6K1 can be seen on the immunblot for pT389-S6K1, as indicated. The data from these cultured cells are representative of a total of three independent experiments.
Figure 5
Figure 5
Inhibition of NOX4 in primary hepatocytes dysregulates key mRNAs in lipid and glucose control, thereby recapitulating harmful features of hepatic SEIRR. As indicated, rat primary hepatocytes were placed in media supplemented with 0 (Vehicle) or 1.0 μM DPI (an inhibitor of NOX4) and then incubated for 30 min at 37ºC, after which the media were further supplemented to achieve insulin concentrations of 0 or 10nM. The cells were incubated for an additional 6h, to allow mRNA levels to change, and then harvested. Levels of Apoc3 (Panel A), Pepck (Panel B), and Srebp1c (Panel C) mRNA were assessed by way of qRT-PCR, normalized to β-actin mRNA levels ( Ct), and then expressed relative to the mean value from the cells that had been incubated with neither DPI nor insulin (2−ΔΔCt; mean±SEM, n=4). Displayed are quantifications of mRNA levels in a single set of cells. P<0.005 by ANOVA; columns labeled with different lowercase letters (a, b, c, d) are statistically different by the Student-Newman-Keuls test (P<0.01).
Figure 5
Figure 5
Inhibition of NOX4 in primary hepatocytes dysregulates key mRNAs in lipid and glucose control, thereby recapitulating harmful features of hepatic SEIRR. As indicated, rat primary hepatocytes were placed in media supplemented with 0 (Vehicle) or 1.0 μM DPI (an inhibitor of NOX4) and then incubated for 30 min at 37ºC, after which the media were further supplemented to achieve insulin concentrations of 0 or 10nM. The cells were incubated for an additional 6h, to allow mRNA levels to change, and then harvested. Levels of Apoc3 (Panel A), Pepck (Panel B), and Srebp1c (Panel C) mRNA were assessed by way of qRT-PCR, normalized to β-actin mRNA levels ( Ct), and then expressed relative to the mean value from the cells that had been incubated with neither DPI nor insulin (2−ΔΔCt; mean±SEM, n=4). Displayed are quantifications of mRNA levels in a single set of cells. P<0.005 by ANOVA; columns labeled with different lowercase letters (a, b, c, d) are statistically different by the Student-Newman-Keuls test (P<0.01).
Figure 6
Figure 6
Deficiency of NOX4 in cultured liver cells impairs hypolipidemic and hypoglycemic functions, thereby recapitulating key harmful features of SEIRR in vivo. Panel A: NOX4 deficiency impairs glucose uptake by McArdle hepatocytes. Cells were pre-treated with non-target (NT) or Nox4 siRNA, supplemented with 0 or 10nM insulin, as indicated, and then exposed to [3H]2-deoxy-D-glucose for the final 4 min. Displayed are cellular tritium dpms per mg of cellular protein (mean±SEM, n=3). P<0.001 by ANOVA; columns labeled with different lowercase letters (a, b, c) are statistically different by the Student-Newman-Keuls test (P<0.01). Panel B: NOX4 deficiency impairs the ability of insulin to suppress SULF2 expression (Remnant lipoprotein clearance from Figure 1). McArdle cells were treated with non-target (NT) or Nox4 siRNA, without or with insulin, as indicated. Cells were harvested 18h after the addition of insulin, to allow time to degrade pre-existing SULF2 protein. Displayed are immunoblots in triplicate for SULF2 and, as a loading control, β-actin.
Figure 6
Figure 6
Deficiency of NOX4 in cultured liver cells impairs hypolipidemic and hypoglycemic functions, thereby recapitulating key harmful features of SEIRR in vivo. Panel A: NOX4 deficiency impairs glucose uptake by McArdle hepatocytes. Cells were pre-treated with non-target (NT) or Nox4 siRNA, supplemented with 0 or 10nM insulin, as indicated, and then exposed to [3H]2-deoxy-D-glucose for the final 4 min. Displayed are cellular tritium dpms per mg of cellular protein (mean±SEM, n=3). P<0.001 by ANOVA; columns labeled with different lowercase letters (a, b, c) are statistically different by the Student-Newman-Keuls test (P<0.01). Panel B: NOX4 deficiency impairs the ability of insulin to suppress SULF2 expression (Remnant lipoprotein clearance from Figure 1). McArdle cells were treated with non-target (NT) or Nox4 siRNA, without or with insulin, as indicated. Cells were harvested 18h after the addition of insulin, to allow time to degrade pre-existing SULF2 protein. Displayed are immunoblots in triplicate for SULF2 and, as a loading control, β-actin.

Comment in

References

    1. Jiang ZY, Lin YW, Clemont A, Feener EP, Hein KD, Igarashi M, Yamauchi T, White MF, King GL. Characterization of selective resistance to insulin signaling in the vasculature of obese Zucker (fa/fa) rats. J Clin Invest. 1999;104:447–457. - PMC - PubMed
    1. Cusi K, Maezono K, Osman A, Pendergrass M, Patti ME, Pratipanawatr T, DeFronzo RA, Kahn CR, Mandarino LJ. Insulin resistance differentially affects the PI 3-kinase- and MAP kinase-mediated signaling in human muscle. J Clin Invest. 2000;105:311–320. - PMC - PubMed
    1. Shimomura I, Matsuda M, Hammer RE, Bashmakov Y, Brown MS, Goldstein JL. Decreased IRS-2 and increased SREBP-1c lead to mixed insulin resistance and sensitivity in livers of lipodystrophic and ob/ob mice. Mol Cell. 2000;6:77–86. - PubMed
    1. Muniyappa R, Montagnani M, Koh KK, Quon MJ. Cardiovascular actions of insulin. Endocr Rev. 2007;28:463–491. - PubMed
    1. Williams KJ, Tabas I. The response-to-retention hypothesis of early atherogenesis. Arterioscler Thromb Vasc Biol. 1995;15:551–561. - PMC - PubMed

Publication types

MeSH terms