. 2012;7(2):e31467.
doi: 10.1371/journal.pone.0031467. Epub 2012 Feb 6.

Cell-to-cell signaling influences the fate of prostate cancer stem cells and their potential to generate more aggressive tumors

Affiliations

Cell-to-cell signaling influences the fate of prostate cancer stem cells and their potential to generate more aggressive tumors

Luisa Salvatori et al. PLoS One. 2012.

Abstract

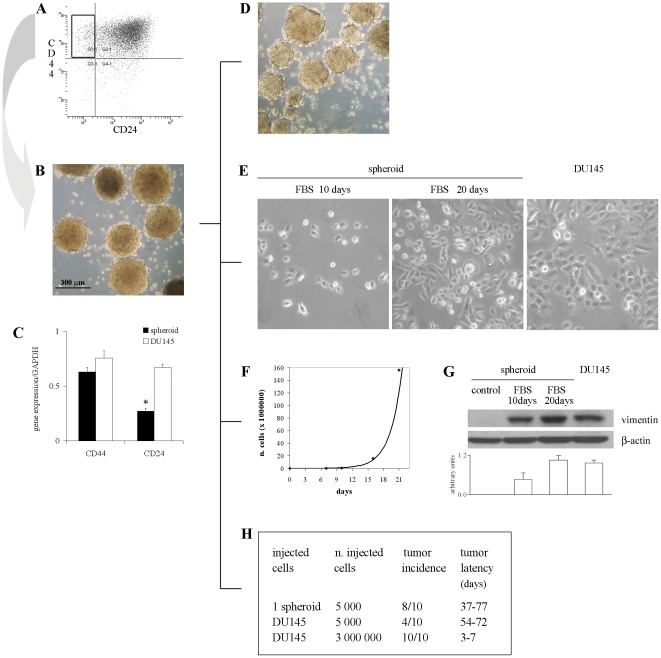
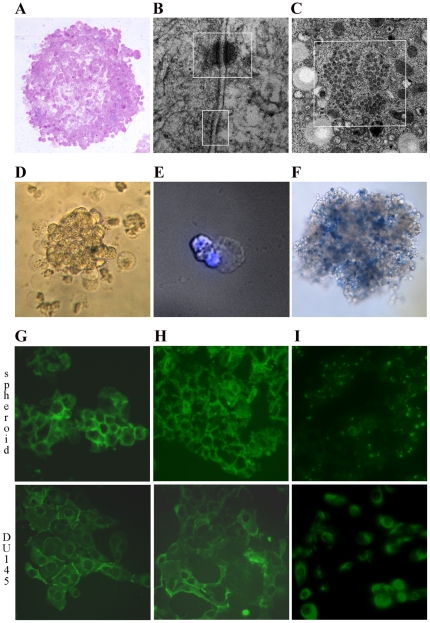
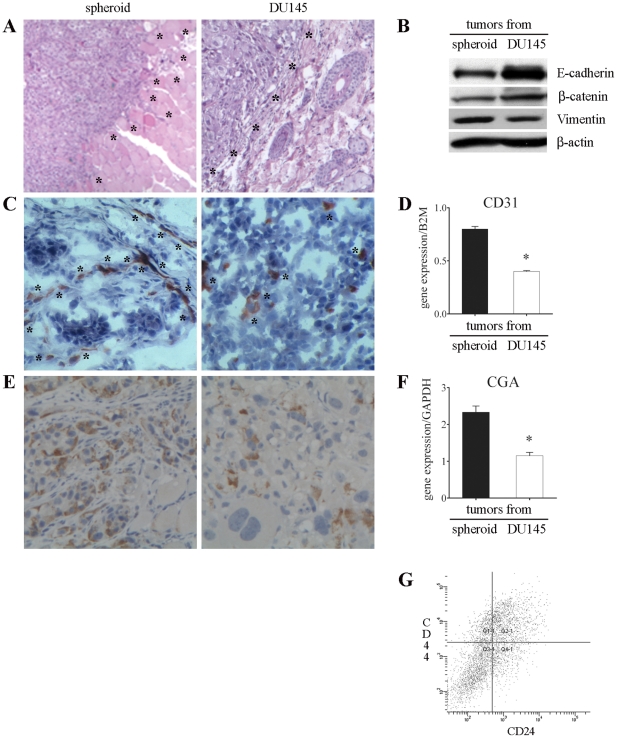
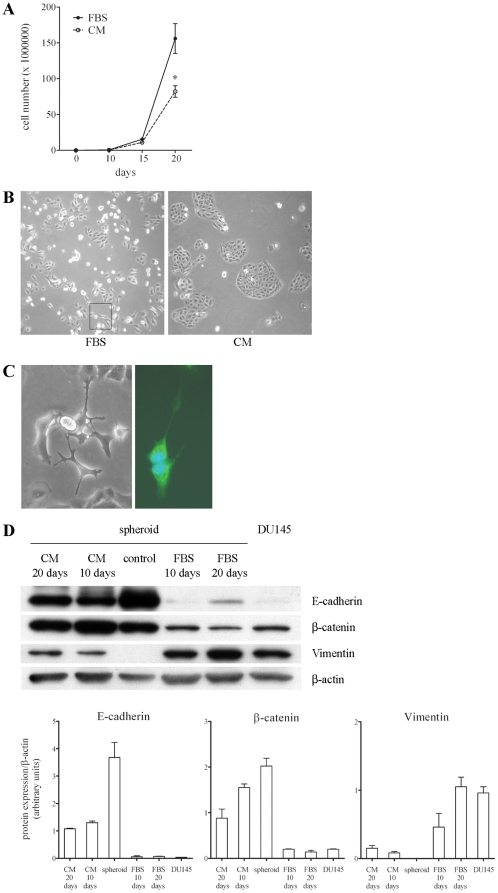
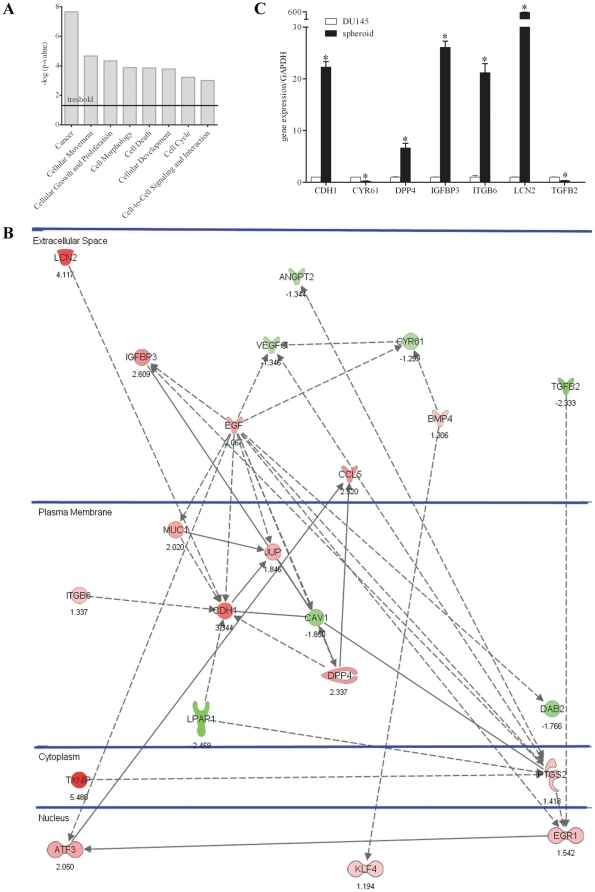
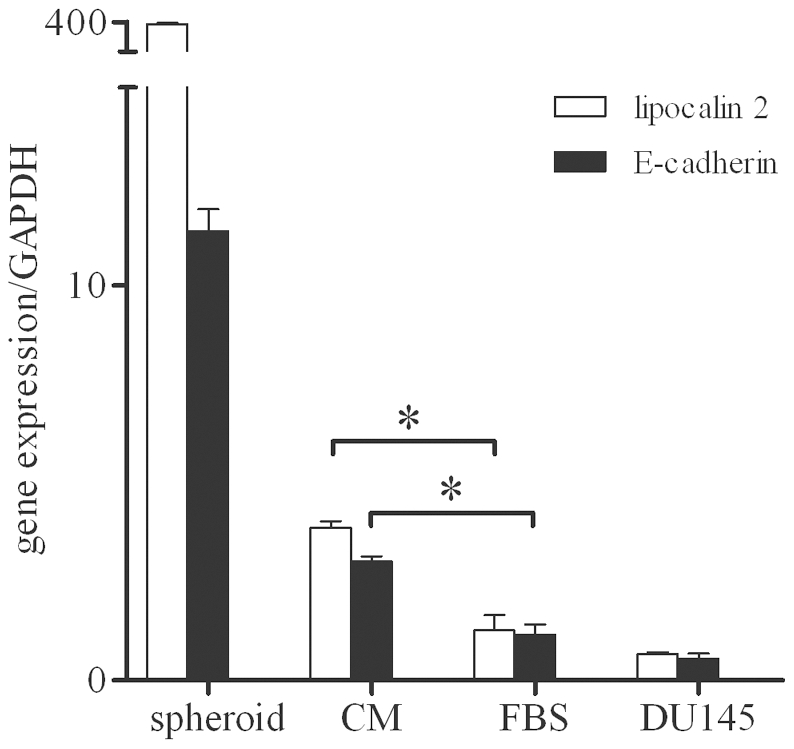
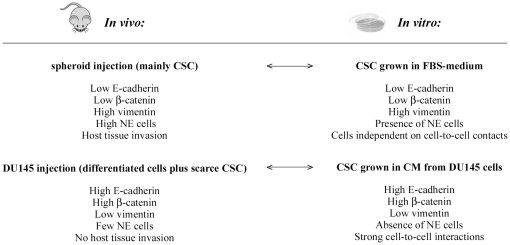
An increasing number of malignancies has been shown to be initiated and propelled by small subpopulations of cancer stem cells (CSC). However, whether tumor aggressiveness is driven by CSC and by what extent this property may be relevant within the tumor mass is still unsettled. To address this issue, we isolated a rare tumor cell population on the basis of its CD44(+)CD24(-) phenotype from the human androgen-independent prostate carcinoma cell line DU145 and established its CSC properties. The behavior of selected CSC was investigated with respect to the bulk DU145 cells. The injection of CSC in nude mice generated highly vascularized tumors infiltrating the adjacent tissues, showing high density of neuroendocrine cells and expressing low levels of E-cadherin and β-catenin as well as high levels of vimentin. On the contrary, when a comparable number of unsorted DU145 cells were injected the resulting tumors were less aggressive. To investigate the different features of tumors in vivo, the influence of differentiated tumor cells on CSC was examined in vitro by growing CSC in the absence or presence of conditioned medium from DU145 cells. CSC grown in permissive conditions differentiated into cell populations with features similar to those of cells held in aggressive tumors generated from CSC injection. Differently, conditioned medium induced CSC to differentiate into a cell phenotype comparable to cells of scarcely aggressive tumors originated from bulk DU145 cell injection. These findings show for the first time that CSC are able to generate differentiated cells expressing either highly or scarcely aggressive phenotype, thus influencing prostate cancer progression. The fate of CSC was determined by signals released from tumor environment. Moreover, using microarray analysis we selected some molecules which could be involved in this cell-to-cell signaling, hypothesizing their potential value for prognostic or therapeutic applications.


Conflict of interest statement

Competing Interests: The authors have declared that no competing interests exist.

Figures

Figure 1
Figure 1. Sorting, culture and characterization of stem-like cells from DU145 cell line.
(A) FACS analysis of CD44 and CD24 expression in DU145 cells. (B) Culture of isolated CD44+CD24 cells growing in SRM as nonadherent prostaspheres (5× objective). (C) Q-PCR of CD44 and CD24 expression in spheroid and DU145 cells. Data are presented as mean ± SEM from 3 experiments. *, p<0.05 vs DU145 cells. (D) Self-renewal capacity of spheroids. Serum supplementation and the withdrawal of growth factors induce the growth of spheroid cells as adherent cells with morphology (E), proliferation rate (F) and expression of vimentin (G) comparable to DU145 cells. Photographs of spheroid cells were taken under a phase contrast microscope after 10 and 20 days of growth in FBS-containing medium (20×). The representative western blots show the expression of vimentin and β-actin in spheroid cells grown in FBS-supplemented medium with respect to control spheroids and DU145 cells. The histogram displays the densitometric quantification of vimentin normalized to β-actin levels. Values are expressed as mean ± SEM from 3 independent experiments. (H) Tumor incidence and latency after injection of 1 spheroid, 5,000 or 3×10⁶ DU145 cells in NOD/SCID mice.
Figure 2
Figure 2. Structure and composition of spheroids.
(A) Phase contrast evaluation of spheroid structure (10×). (B) TEM analysis showing desmosomes and adherent junctions (top and bottom, respectively) as well as the annulate lamellae (C) in spheroid cells. (D) Phase contrast (20×) of a fragment of spheroid surrounded by cells characterized by protruding blebs of empty cytoplasm, which present intact nuclei as shown by DAPI staining (40×, E). (F) Staining with trypan blue shows the presence of dead cells in spheroids (10×). Immunofluorescence staining of a section of spheroids and DU145 cells (original magnification ×200) showing the expression of E-cadherin (G), β-catenin (H) and vimentin (I).
Figure 3
Figure 3. Analysis of tumors generated in NOD/SCID mice.
(A) Histological staining with H&E of tumors grown following the injection of 1 spheroid or 5,000 DU145 cells showing highly invasive (left panel) and scantly invasive (right) phenotype (5×). Asterisks indicate the borders between tumors and the surrounding tissues. (B) Representative western blots showing the expression of E-cadherin, β-catenin and vimentin in tumors. (C) IHC staining with anti-mouse CD31 antibody highlighting higher vessel density in spheroid-derived tumors (indicated by asterisks, left panel) compared to tumors from DU145 cells (right). (D) Q-PCR showing mouse CD31 expression in tumors. Mouse B2M was used as endogenous control. Values are mean ± SEM from 3 experiments. *, p<0.05 relative to tumors generated from spheroid. (E) IHC with anti-CD56 antibody showing higher density of NE cells in tumors generated from spheroid than from DU145 cells (20×). (F) Q-PCR displaying CGA mRNA level in tumors. Results are expressed as ratios between the target gene and the endogenous control GAPDH and represent mean ± SEM from 3 independent experiments. *, p<0.05 with respect to tumors generated from spheroid. (G) A representative FACS analysis showing the presence of CD44+CD24 cells in tumors generated from the injection of 1 spheroid in mice. Tumors originating from the injection of 5,000 DU145 cells showed a comparable CD44+CD24 cell population (data not shown).
Figure 4
Figure 4. Effect of CM from DU145 cells on the phenotype of CSC.
(A) The proliferation of CSC contained in spheroids grown in FBS-containing medium or in CM from DU145 cells was evaluated at different times of culture. Data are shown as the mean ± SEM from 3 experiments. Asterisks indicate a significant inhibitory effect of CM with respect to FBS-medium (*, p<0.05). (B) Phase contrast (10×) of cells after 20 days in FBS-containing medium or in CM showing the different pattern of cell growth. In the left panel, the rectangle highlights the presence of NE cells. (C) Phase contrast (left, 20×) and IF staining (right, 40×) of branched NE cells generated from CSC grown in FBS-medium. In particular, the right panel shows the expression of CD56 in the cytoplasm and in the long cell processes. (D) Representative western blots showing the changes in the expression of E-cadherin, β-catenin, and vimentin in spheroid CSC grown in the different culture conditions with respect to control spheroids and DU145 cells. The expression levels of the 3 proteins were determined by densitometric analysis of the respective bands and normalized to β-actin levels. Values reported in the histograms are mean ± SEM from 3 independent experiments.
Figure 5
Figure 5. Analysis of CSC vs DU145 cells by microarray, IPA and Q-PCR analysis.
(A) Selected 8 top biological functions found enriched within the set of transcripts modulated in CSC with respect to total DU145 cells by microarray analysis. (B) The 22 deregulated genes, as determined by IPA, are positioned in subcellular layouts, and relationships are marked by arrows: filled and dashed line arrows mark direct and indirect interactions, respectively. Genes in red showed increased expression in CSC, while genes in green were down-regulated. (C) Differences in gene expression determined by microarray analysis were confirmed by Q-PCR, choosing 7 representative genes among selected 22. Results are expressed as ratio between each target gene and the endogenous control GAPDH. Expression in CSC was compared to what was observed in DU145 cells to which a value equal to 1 was arbitrarily assigned. Values are mean ± SEM from 3 experiments. *, p<0.05 relative to DU145 cells.
Figure 6
Figure 6. Influence of culture conditions on the expression of lipocalin-2 and E-cadherin in CSC.
Q-PCR showing changes in mRNA levels for lipocalin-2 and E-cadherin in DU145 cells, CSC contained in control spheroids, and CSC grown for 20 days in FBS-medium or CM from DU145 cells. Data represent mean ± SEM from 3 individual experiments. Asterisks indicate a significant difference (*, p<0.05).
Figure 7
Figure 7. Parallelism between the phenotype of cells held in tumors and of CSC grown in vitro.
In particular, CSC grown in FBS-medium aimed to reproduce the injection of 1 spheroid in mice, whereas CSC grown in CM from DU145 cells allowed us to simulate the injection of 5,000 unsorted DU145 cells.

References

    1. Jemal A, Siegel R, Xu J, Ward E. Cancer statistics. CA Cancer J Clin. 2010;60:277–300. - PubMed
    1. Feldman BJ, Feldman D. The development of androgen-independent prostate cancer. Nat Rev Cancer. 2001;1:34–45. - PubMed
    1. Bonkhoff H, Stein U, Remberger K. Androgen receptor status in endocrine-paracrine cell types of the normal, hyperplastic and neoplastic human prostate. Virchows Arch A Pathol Anat Histopathol. 1993;423:291–294. - PubMed
    1. Debes JD, Tindall DJ. Mechanisms of androgen-refractory prostate cancer. N Engl J Med. 2004;351:1488–1490. - PubMed
    1. Abrahamsson PA, Di Sant'Agnese PA. Neuroendocrine cells in the human prostate gland. J Androl. 1993;14:307–309. - PubMed

Publication types