. 2012 Jan;2(1):56-67.
doi: 10.1158/2159-8290.CD-11-0170.

Genomic complexity and AKT dependence in serous ovarian cancer

Affiliations

Genomic complexity and AKT dependence in serous ovarian cancer

Aphrothiti J Hanrahan et al. Cancer Discov. 2012 Jan.

Erratum in

  • Cancer Discov. 2012 Apr;2(4):376. Janikariman, Manickam [corrected to Janakiraman, Manickam]

Abstract

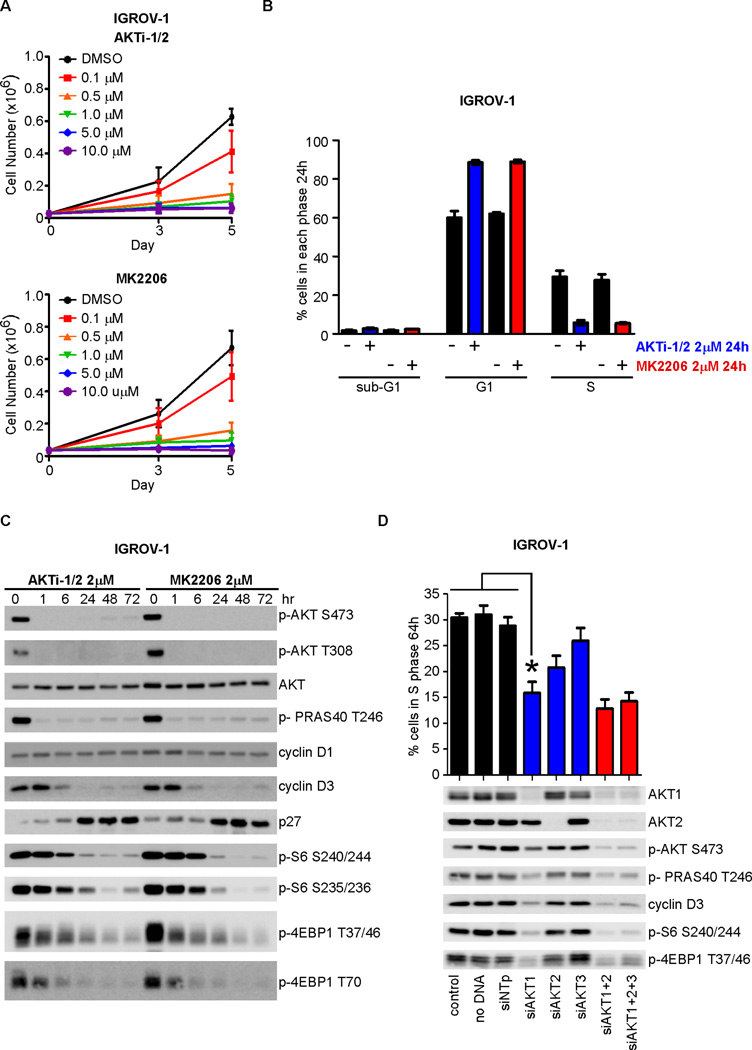
Effective oncoprotein-targeted therapies have not yet been developed for ovarian cancer. To explore the role of PI3 kinase/AKT signaling in this disease, we performed a genetic and functional analysis of ovarian cancer cell lines and tumors. PI3K pathway alterations were common in both, but the spectrum of mutational changes differed. Genetic activation of the pathway was necessary, but not sufficient, to confer sensitivity to selective inhibition of AKT and cells with RAS pathway alterations or RB1 loss were resistant to AKT inhibition, whether or not they had coexistent PI3K/AKT pathway activation. Inhibition of AKT1 caused growth arrest in a subset of ovarian cell lines, but not in those with AKT3 expression, which required pan-AKT inhibition. Thus, a subset of ovarian tumors are sensitive to AKT inhibition, but the genetic heterogeneity of the disease suggests that effective treatment with AKT pathway inhibitors will require a detailed molecular analysis of each patient's tumor.

Significance: A subset of ovarian cancers exhibits AKT pathway activation and is sensitive to selective AKT inhibition. Ovarian tumors exhibit significant genetic heterogeneity and thus an individualized approach based on real-time, detailed genomic and proteomic characterization of individual tumors will be required for the successful application of PI3K/AKT pathway inhibitors in this disease.

Keywords: AKT; MK2206; Ovarian; PTEN; TCGA.


Figures

Figure 1
Figure 1
Genomic and proteomic profiling of ovarian cancer cell lines. A, Probe-level (blue dots) and segmentation data (red lines) from Agilent 244K arrays identifying representative focal amplification (KRAS in SKOV-8) and focal homozygous deletion (RB1 in SKOV-433) events. The vertical green line crosses the x-axis at the chromosomal position of the gene. Y-axis indicates log2 copy-number signal. B, Immunoblot analysis of the ovarian cancer cell line panel for expression of AKT1/2/3, phosphorylated AKT (Ser473), and activation and abundance of key downstream targets. Cells were arranged based upon the presence of PI3K/AKT (red) or RAS/RAF-pathway alterations (blue) and RB1 loss (green).
Figure 2
Figure 2
AKT dependence of ovarian cancer cell lines. A, IC50/90 values for the AKT-1/2 inhibitor (AKTi-1/2) and panAKT-1/2/3 inhibitor (MK2206) were calculated following treatment with 0–10 µM of each inhibitor for 5 days. Drug concentrations are represented by color block gradations from dark red (0–0.3 µM) to bright red (0.3–1.7 µM), dark pink (1.7–3 µM), pale pink (3–10 µM), and white (>10 µM). Cells with detectable AKT3 expression are indicated by black boxes. Cell lines are colored based upon the presence of PI3K/AKT (red) or RAS/RAF-pathway (blue) alterations and RB1 loss (green) as in Fig. 1B. B, Cells were treated for 0–24 h with AKTi-1/2 or MK2206 (2 µM) and lysates immunoblotted for p-AKT S473 and total AKT. C, Day 5 dose response plots of three representative cell lines (IGROV-1, hypersensitive to AKT inhibition, red; OVCAR-5, heightened sensitivity to pan-AKT inhibition, blue; SKOV-433, resistant to AKT inhibition, green).
Figure 3
Figure 3
Consequence of differential AKT isoform inhibition in PTEN-mutant IGROV-1 cells. A, IGROV-1 cells (PTEN-null) were treated with 0–10 µM of either AKTi-1/2 or MK2206 and viable cells counted at days 3 and 5. B, Cell cycle distribution was determined by FACS for IGROV-1 cells treated with AKTi-1/2 or MK2206 (2 µM) for 24 h. C, Immunoblots following treatment of IGROV-1 cells with either 2 µM of AKTi-1/2 or MK2206 for 0–72 h. Lysates were probed for p-AKT (S473 and T308), pPRAS40 (T246) and cell cycle and translation regulators as indicated. D, Control siRNA (siNTp) or siRNA against individual AKT isoforms, alone or in combination, were transfected into IGROV-1 cells followed by incubation for 64 h. Cells were collected for FACS analysis (asterisks indicates p≤0.0015, n≥3) or subjected to immunoblotting.
Figure 4
Figure 4
RAS/RAF pathway-activated ovarian cancer cells exhibit MEK dependence and synergistic induction of apoptosis with combined MEK/AKT inhibition. A, Levels of activated RAS (RAS-GTP) were determined by pulldown of GTP-bound RAS using recombinant RAS binding domain of RAF. Input lysates were also immunoblotted as shown. B, IC50/90 values for the allosteric inhibitor of MEK1/2, PD0325901 (PD901) were calculated following treatment with 0–500 nM of inhibitor for 5 days. Immunoblots for p-ERK and ERK following treatment with PD901 (50 nM) for 0–24 h. C, Induction of cell death following combined treatment with 50 nM PD901 and increasing doses of either AKTi-1/2 or MK2206 (2 or 10 µM) was measured by FACS analysis at 72 h in OVCAR-5 cells. Maximal cell death was induced following co-treatment with PD901 and MK2206 (asterisk indicates p ≤ 0.0287 vs. all other treatments, n ≥3). D, OVCAR-5 cells were treated with PD901 (50 nM) or MK2206 (10 µM) alone or in combination for 48 h and lysates immunoblotted.
Figure 5
Figure 5
The ovarian cancer cell lines modestly recapitulate the spectrum of mutations found in primary ovarian tumors. A, Heat map showing the concordance of PI3K and RAS pathway alterations and RB1 deletions/mutations for 316 serous ovarian cancer TCGA samples. Amplifications are indicated in solid-red, homozygous deletions in solid-blue, and somatic mutations in green. Overexpression of AKT3 is indicated by a hollow, red rectangle. B, log2 mRNA expression was assessed as a function of GISTIC-based DNA copy-number calls (homozygous deletion, hemizygous loss, diploid, gain, high-level amplification) across all samples. p-values were generated using ANOVA analysis. The red line in the AKT3 box-plot indicates the cutoff for samples with significant mRNA overexpression (red ‘x’) as defined by greater than two standard deviations of the mean of the samples that are diploid/copy-neutral for AKT3. C, Copy-number heatmaps demonstrating the focality of the amplifications encompassing the KRAS, PIK3CA, and AKT3 loci. X-axis illustrates the copy number status (red: amplification, white: copy neutral, blue: deletion) of the indicated gene for each of the 316 TCGA samples listed on y-axis.
Figure 6
Figure 6
PTEN genotype frequently dictates PTEN expression status, but evidence of heterogeneous staining implies polyclonality within some ovarian tumors. A, Copy number heatmap of the ovarian TCGA samples showing that a subset harbor focal deletion of the PTEN locus. X-axis represents the copy number status (blue: deletion, white: copy neutral, red: amplification) of the PTEN gene for each of the 316 TCGA samples listed on y-axis. B, log2 mRNA expression as a function of GISTIC-based copy-number status at the PTEN locus (p-values as indicated, ANOVA). Circled tumors indicate PTEN mRNA and copy-number status of the corresponding tumors in Fig. 6C. C, H&E, PTEN and p-AKT S473 immunohistochemistry of representative ovarian TCGA tumors with PTEN-negative, heterogeneous and positive staining. D, Mean p-AKT S473 IHC scores as a function of GISTIC-based copy-number calls at the PTEN locus. Dots represent average p-AKT IHC score +/− S.E for each group (asterisks indicate p ≤ 0.0276 vs. PTEN homozygous deleted).

Comment in

References

    1. Vanhaesebroeck B, Guillermet-Guibert J, Graupera M, Bilanges B. The emerging mechanisms of isoform-specific PI3K signalling. Nat Rev Mol Cell Biol. 2010;11:329–341. - PubMed
    1. Staal SP. Molecular cloning of the akt oncogene and its human homologues AKT1 and AKT2: amplification of AKT1 in a primary human gastric adenocarcinoma. Proc Natl Acad Sci U S A. 1987;84:5034–5037. - PMC - PubMed
    1. Bast RC, Jr, Hennessy B, Mills GB. The biology of ovarian cancer: new opportunities for translation. Nat Rev Cancer. 2009;9:415–428. - PMC - PubMed
    1. Levanon K, Crum C, Drapkin R. New insights into the pathogenesis of serous ovarian cancer and its clinical impact. J Clin Oncol. 2008;26:5284–5293. - PMC - PubMed
    1. Landen CN, Jr, Birrer MJ, Sood AK. Early events in the pathogenesis of epithelial ovarian cancer. J Clin Oncol. 2008;26:995–1005. - PubMed

Publication types

MeSH terms

Substances