Review
. 2012;29(1-2):7-33.
doi: 10.1080/02643294.2012.654773. Epub 2012 Feb 13.

Questioning the questions that have been asked about the infant brain using near-infrared spectroscopy

Affiliations
Review

Questioning the questions that have been asked about the infant brain using near-infrared spectroscopy

Richard N Aslin. Cogn Neuropsychol. 2012.

Abstract

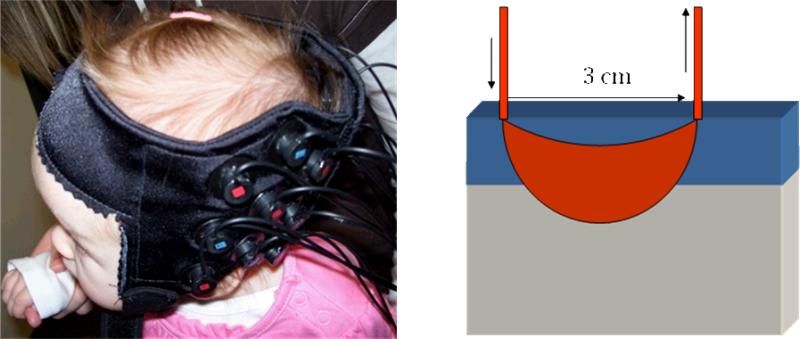
Near-infrared spectroscopy (NIRS) is a noninvasive diffuse optical-imaging technique that can measure local metabolic demand in the surface of the cortex due to differential absorption of light by oxygenated and deoxygenated blood. Over the past decade, NIRS has become increasingly used as a complement to other neuroimaging techniques, such as electroencephalography (EEG), magnetoencephalography (MEG), and functional magnetic resonance imaging (fMRI), particularly in paediatric populations who cannot easily be tested using fMRI and MEG. In this review of empirical findings from human infants, ranging in age from birth to 12 months of age, a number of interpretive concerns are raised about what can be concluded from NIRS data. In addition, inconsistencies across studies are highlighted, and strategies are proposed for enhancing the reliability of NIRS data gathered from infants. Finally, a variety of new and promising advances in NIRS techniques are highlighted.


Figures

Figure 1
Figure 1
Left: Infant wearing a cap holding an array of 9 optical fibers to gather data from 12 NIRS channels over the left temporal cortex. Right: Schematic of a NIRS channel, showing the input and output optical fibers and the banana-shaped pathway of photons that dip into the gray matter of the brain after passing through superficial layers of skin, skull, and surface vasculature.
Figure 2
Figure 2
Estimates of the Hemodynamic Response Functions from the newborn temporal cortex (dashed line = adult HRF from fMRI). [Reprinted with permisson from Minagawa-Kawai et al., 2011].
Figure 3
Figure 3
Data from Pena et al. (2003), showing 12 NIRS channels from the left and right temporal cortices. Each channel provided a measure of oxyhemogloben (red), deoxy (blue, and total (green) to forward vs. backward speech. Dashed area in each hemisphere indicates targeted ROI (posterior temporal). [Reprinted with permission].
Figure 4
Figure 4
A single NIRS channel over prefrontal cortex from Nakano et al. (2008) showing decreasing activations in 3 blocks of 5 trials to a speech category, following by recovery to a novel speech category (orange) in the 4th block but not to a no-change control group (green). [Reprinted with permission].
Figure 5
Figure 5
Data from Gervain et al. (2008) showing left anterior responses and a learning effect. [Reprinted with permission].
Figure 6
Figure 6
Data from White and Culver (2010) gathered over occipital NIRS channels as a flickered checkerboard wedge rotates around the visual field. NIRS activations (right panels) are 180 deg out of phase with the location of the wedge stimulus. [Reprinted with permission].
Figure 7
Figure 7
Placement of the NIRS channels in Hyde et al. (2010) and the resultant activations to changes in number or shape over right hemisphere occipital and parietal locations in 6-month-olds. [Reprinted with permission].
Figure 8
Figure 8
Configuration of near and far channel separations from Saager, Telleri, and Berger (2011) and the resultant reduction in variance for individual subjects in far-only vs. near-corrected C-NIRS activations. [Reprinted with permission].
Figure 9
Figure 9
Functional connectivity among 94 NIRS channels during sleep gathered from newborns, 3-, and 6-month-olds by Homae et al. (2010). [Reprinted with permission].

References

    1. Anderson AW, Marois R, Colson ER, Peterson BS, Duncan CC, Ehrenkranz RA, Konstantino M, Sarofin H, Schneider KC, Gore JC, Ment LR. Neonatal Auditory Activation Detected by Functional Magnetic Resonance Imaging. Magnetic Resonance Imaging. 2001;19:1–5. - PubMed
    1. Aoyama S, Toshima T, Saito Y, Konishi N, Motoshige K, Ishikawa N, Nakamura K, Kobayashi M. Maternal breast milk odour induces frontal lobe activation in neonates: A NIRS study. Early Human Development. 2010;86:541–545. - PubMed
    1. Arimitsu T, Uchida-Ota M, Yagihashi T, Kojima S, Watanabe S, Hokuto I, Ikeda K, Takahashi T, Minagawa-Kawai Y. Functional hemisphere specialization in processing phonemic and prosodic auditory changes in neonates. Frontiers in Psychology. 2011;2(202) [doi: 10.3389/fpsyg.2011.00202] - PMC - PubMed
    1. Ashby FG. Statistical Analysis of fMRI Data. MIT Press; Cambridge. MA: 2011.
    1. Aslin RN. What's in a look? Developmental Science. 2007;10:48–53. - PMC - PubMed

Publication types

LinkOut - more resources