. 2012 Feb 1;29(2):A165-73.
doi: 10.1364/JOSAA.29.00A165.

Tests of a functional account of the Abney effect

Affiliations

Tests of a functional account of the Abney effect

Sean F O'Neil et al. J Opt Soc Am A Opt Image Sci Vis. .

Abstract

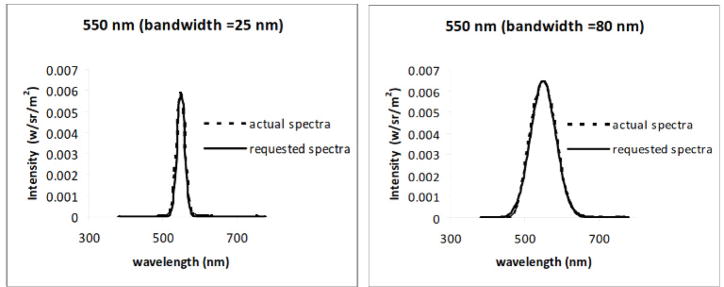
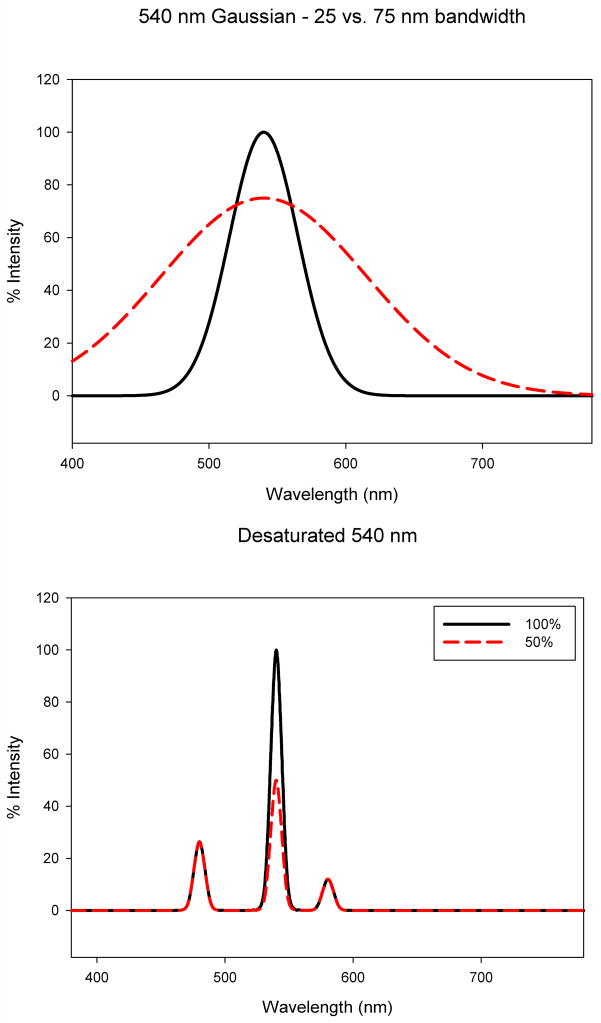
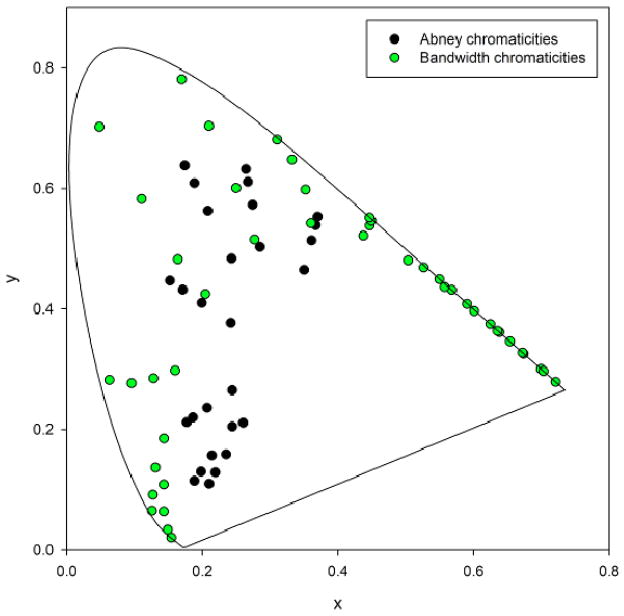
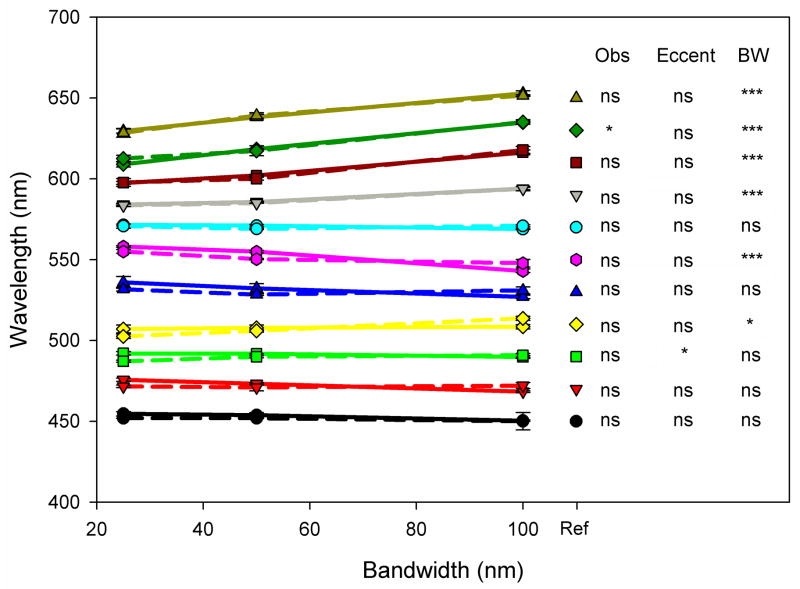
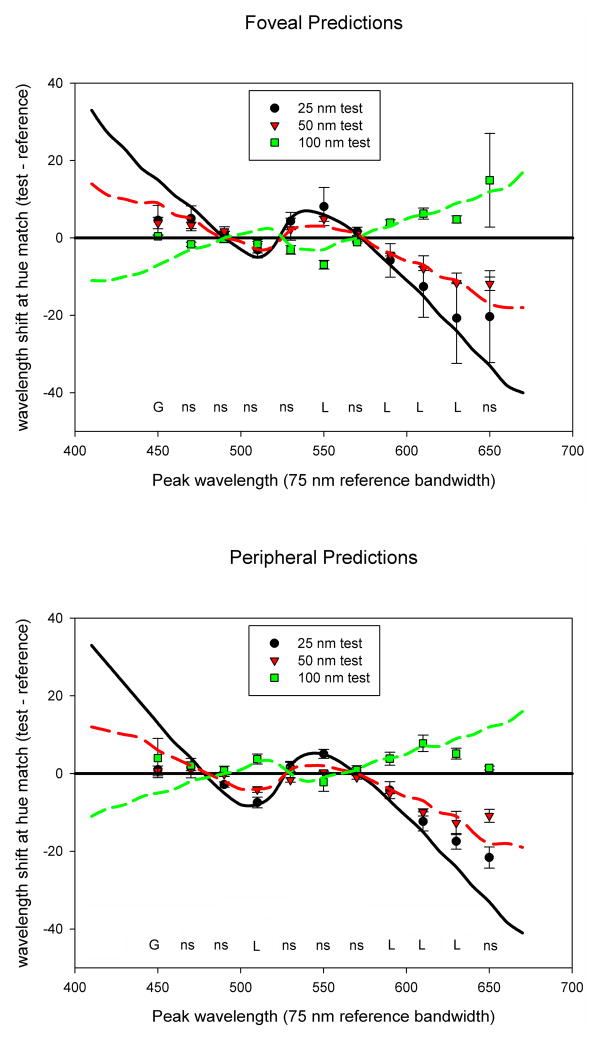
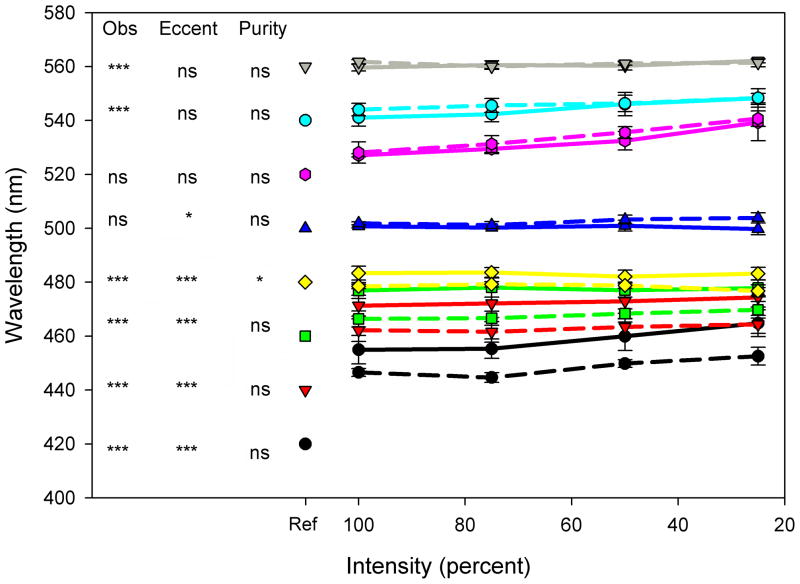
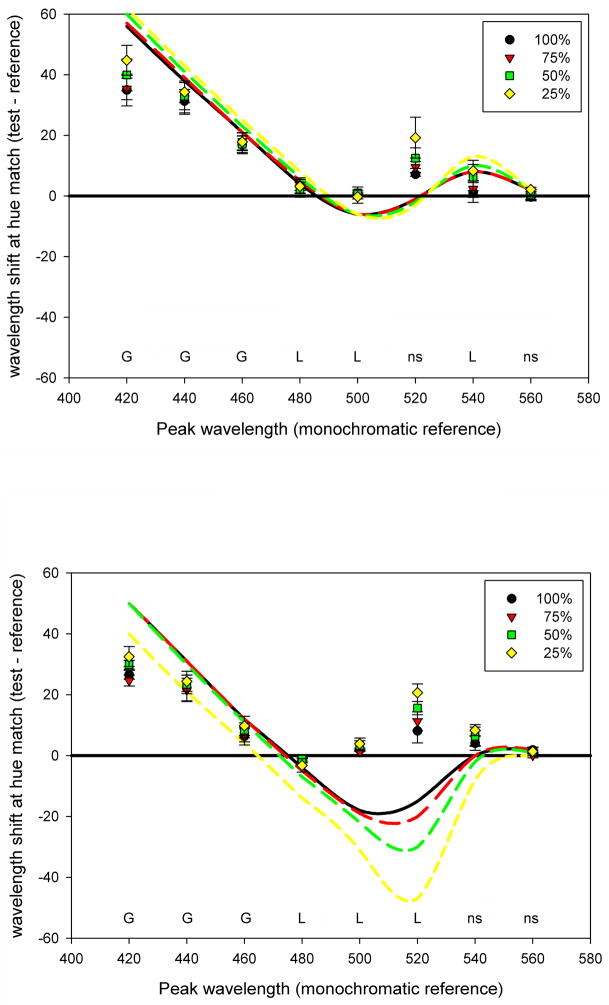
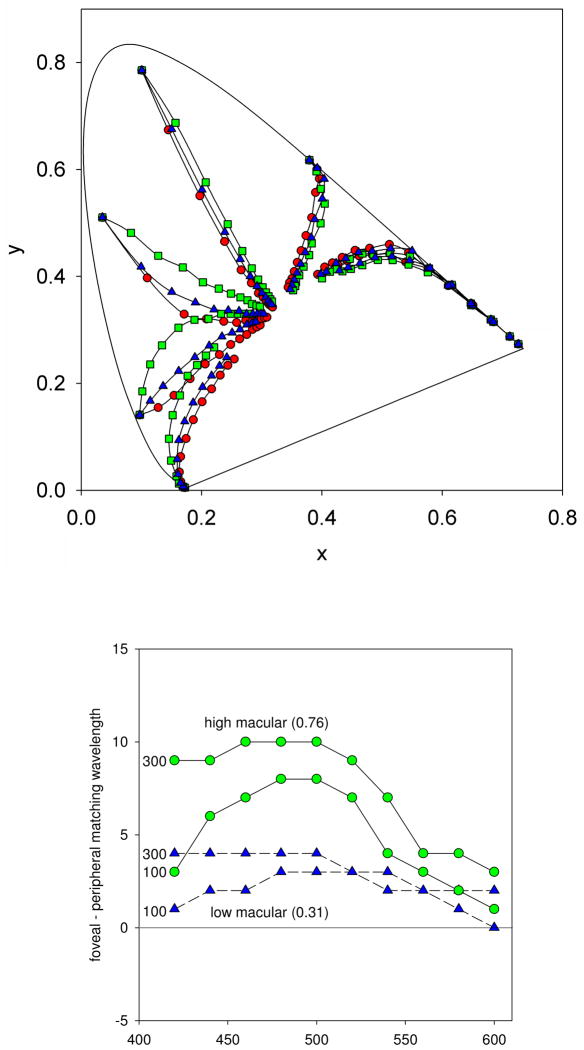
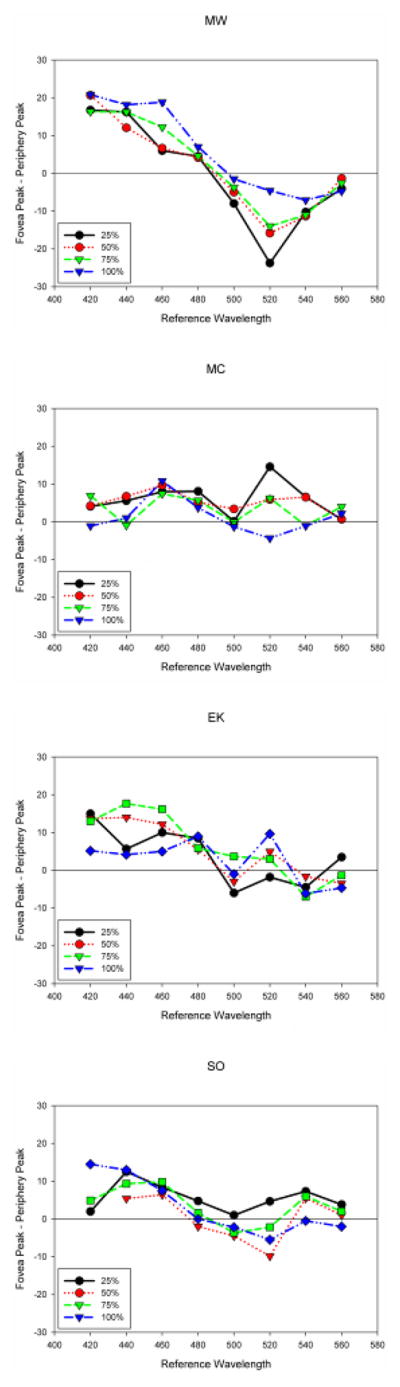
The Abney effect refers to changes in the hue of lights as they are desaturated. Normally the purity is varied by desaturating with a fixed spectrum. Mizokami et al. [J. Vis.6, 996 (2006)] instead varied purity by using Gaussian spectra and increasing their bandwidth. Under these conditions the hues of lights at short and medium wavelengths tended to remain constant and thus were tied to a fixed property of the stimulus such as the spectral peak, possibly reflecting a compensation for the spectral filtering effects of the eye. Here we test this account more completely by comparing constant hue loci across a wide range of wavelengths and between the fovea and periphery. Purity was varied by adding either a fixed spectrum or by varying the spectral bandwidth, using an Agile Light Source capable of generating arbitrary spectra. For both types of spectra, hue loci were approximated by the Gaussian model at short and medium wavelengths, though the model failed to predict the precise form of the hue changes or the differences between the fovea and periphery. Our results suggest that a Gaussian model provides a useful heuristic for predicting constant hue loci and the form of the Abney effect at short and medium wavelengths and may approximate the inferences underlying the representation of hue in the visual system.


Figures

Figure 1
Figure 1
Comparison of requested and generated Gaussian spectra with the OL490 light source.
Figure 2
Figure 2
(Color online) Schematic examples of the two types of stimuli tested. Left: spectra which varied as a Gaussian but differed in bandwidth. Right: Spectra composed of two components – a single peak wavelength of variable height mixed with a fixed pair of complementary wavelengths providing a desaturating white.
Figure 3
Figure 3
(Color online) Representative CIE 1931 chromaticities of the Gaussian (green) and Abney (black) spectra.
Figure 4
Figure 4
(Color online) An illustration of the Abney effect. The center spot shows the undiluted blue from the monitor, while the corner spots are a mixture of equal luminances of the blue and the gray background. Note that the corner spots appear more purple and that the spots may appear to change in hue when directly fixated. The effect is best seen from a distance where each spot subtends ~1°.
Figure 5
Figure 5
(Color online) Average observer settings for Gaussian stimuli with bandwidths of 25, 50, and 100 nm. Symbols plot the peak wavelengths (connected symbols) at three bandwidths that were chosen to match the hue of the reference bandwidth of 75 nm (unconnected symbols at right). Solid lines represent foveal settings and dashed lines represent peripheral settings. Error bars represent the standard error of the mean, and where not shown are smaller than the symbols. Tukey significance columns are for the effects of observer, eccentricity, and bandwidth at each wavelength; *: p < 0.05; **: p < 0.01; ***; p < 0.001; ns = not significant. The interaction was not significant at any wavelength.
Figure 6
Figure 6
(Color online) Shifts in observer settings at each matching bandwidth as a function of the reference peak wavelength. Positive numbers on the Y-axis indicate a shift toward longer wavelengths when the narrower-band light is shown. Lines indicate the predicted pattern if matches are made by maintaining a constant spectral peak (horizontal line, constant prediction for all conditions) or by maintaining constant cone ratios (linear predictions, shown for each stimulus bandwidth). Labels below each set of matches indicate whether the observed matches were better fit by the Gaussian prediction (G) or the linear cone ratios (L); ns = errors of prediction in the two models did not significantly differ.
Figure 7
Figure 7
(Color online) Average observers’ settings for hue matches with the Abney spectra. Unconnected symbols represent the dominant wavelength of the narrowband reference light; corresponding lines show settings for 4 purity levels of the desaturated matching light, corresponding to the relative intensity of the chromatic component of the 3-primary spectrum (with 100% corresponding to the highest saturation). Foveal settings are represented by solid lines and peripheral settings by dashed lines. Error bars represent the standard error of the mean. Significance columns are for the effects of observer, eccentricity, and relative purity at each wavelength, with *: p < 0.05; **: p < 0.01; ***; p < 0.001; ns = not significant.
Figure 8
Figure 8
(Color online) Shifts in the matching wavelength chosen at each saturation level in the Abney stimuli as a function of the reference peak wavelength. Positive numbers on the Y-axis indicate a shift toward longer wavelengths when the narrower band light is shown. Lines indicate the predicted pattern if matches preserve constant cone ratios (horizontal line, constant prediction for all conditions) or preserve constant spectral peaks of Gaussian spectra with the same chromaticity (Gaussian predictions, shown for each stimulus bandwidth). Labels below each set of matches indicate whether the observed matches were better fit by the Gaussian prediction (G) or the linear cone ratios (L); ns = errors of prediction in two models did not significantly differ.
Figure 9
Figure 9
(Color online) a) Predicted Abney effects for observers with different densities of macular pigment (assuming each observer chooses the cone ratios such that constant hues correspond to constant peaks in Gaussian spectra). The three curves show the predictions assuming no macular pigment (e.g. the periphery, red circles) or a peak density of 0.31 (low MP, blue triangles) or 0.76 (high MP, green squares). b) The differences in peak wavelength chosen between the fovea and periphery predicted by the difference in macular pigment, as a function of the reference wavelength. Predictions are shown for two levels of macular pigment density (high or low), and for two different saturation levels of the stimuli corresponding to equivalent Gaussian spectra with a bandwidth of 100 or 300.
Figure 10
Figure 10
(Color online) Observed differences in the magnitude of foveal and peripheral hue shifts for the Abney spectra. Positive differences correspond to larger changes in peak wavelength in the fovea. Each panel plots the results for a single observer, with the different lines corresponding to the different purities of the matching stimulus (as indicated by the % intensity of the variable matching component).

References

    1. Abney W. On the changes in hue of spectrum colors by dilution with white light. Proceedings of the Royal Society of London. 1910;82:120–127.
    1. Westphal H. Unmittlebare Bestimmung der Urfarben. Zeitschrift fur Sinnephysiologie. 1909;44:479–486.
    1. Ayama M, Nakatsue T, Kaiser PK. Constant hue loci of unique and binary balanced hues at 10, 100, and 1000 Td. Color Research and Application. 1987;14:1136–1144. - PubMed
    1. Burns SA, Elsner AE, Pokorny J, Smith VC. The Abney effect: chromaticity coordinates of unique and other constant hues. Vision Res. 1984;24(5):479–489. - PubMed
    1. Ikeda M, Uehira I. Unique hue loci and implications. Color Research and Application. 1989;6:318–324.

Publication types