. 2012 Feb 1;29(2):A258-67.
doi: 10.1364/JOSAA.29.00A258.

Do color appearance judgments interfere with detection of small threshold stimuli?

Affiliations

Do color appearance judgments interfere with detection of small threshold stimuli?

Darren E Koenig et al. J Opt Soc Am A Opt Image Sci Vis. .

Abstract

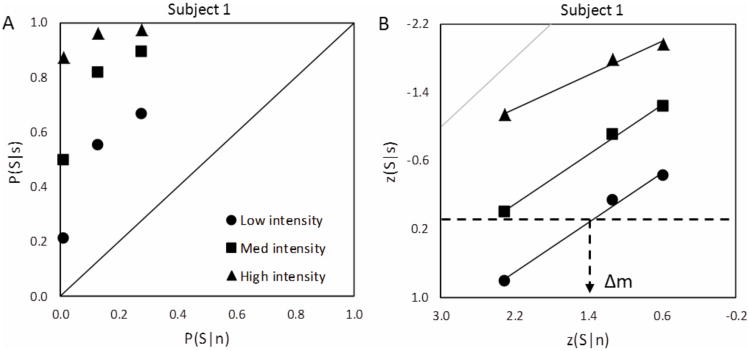
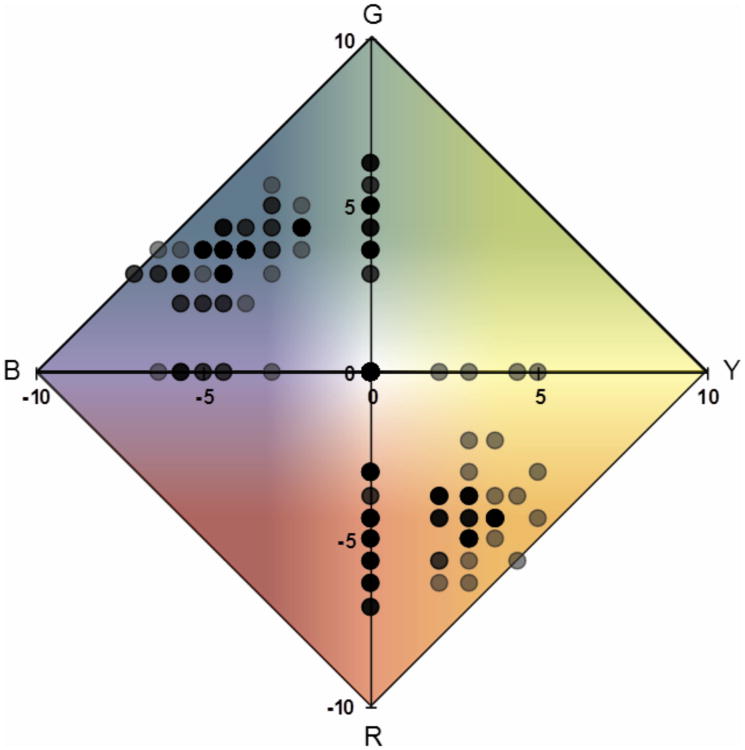
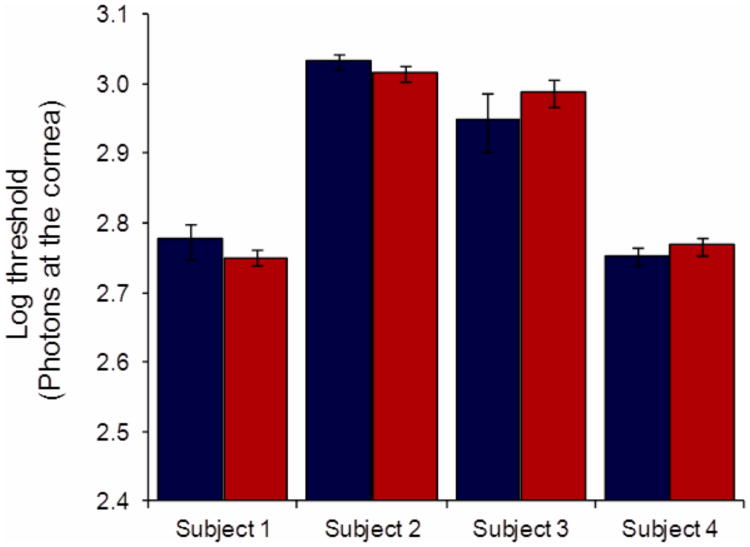
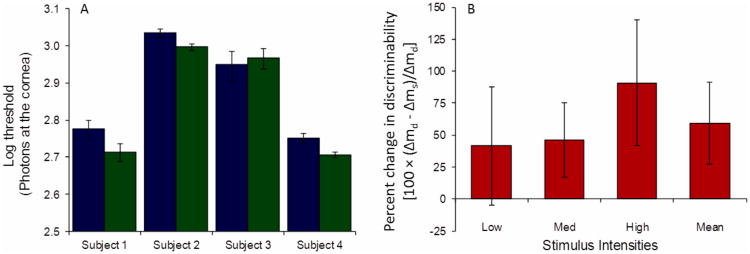
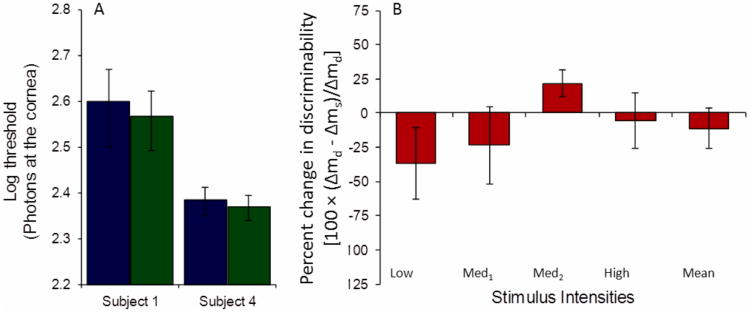
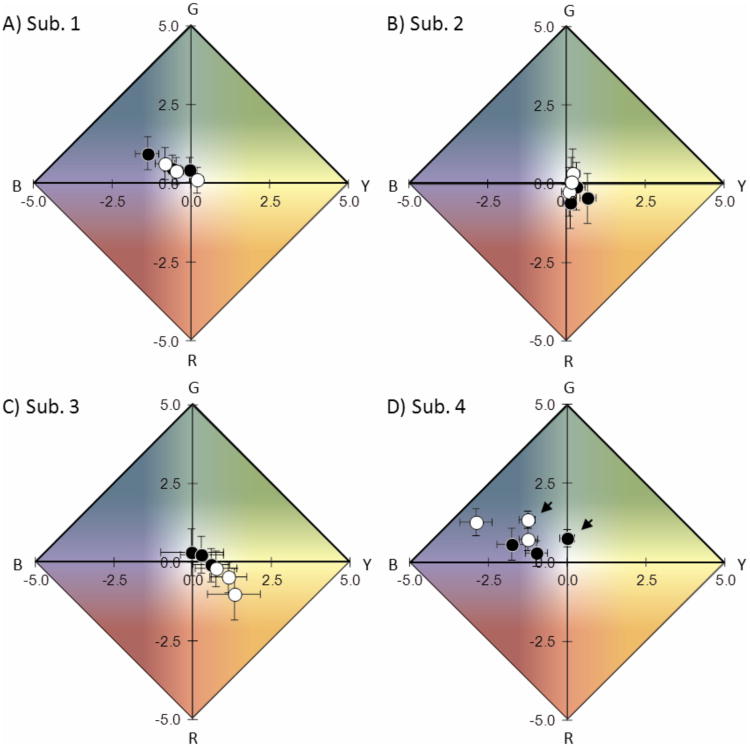
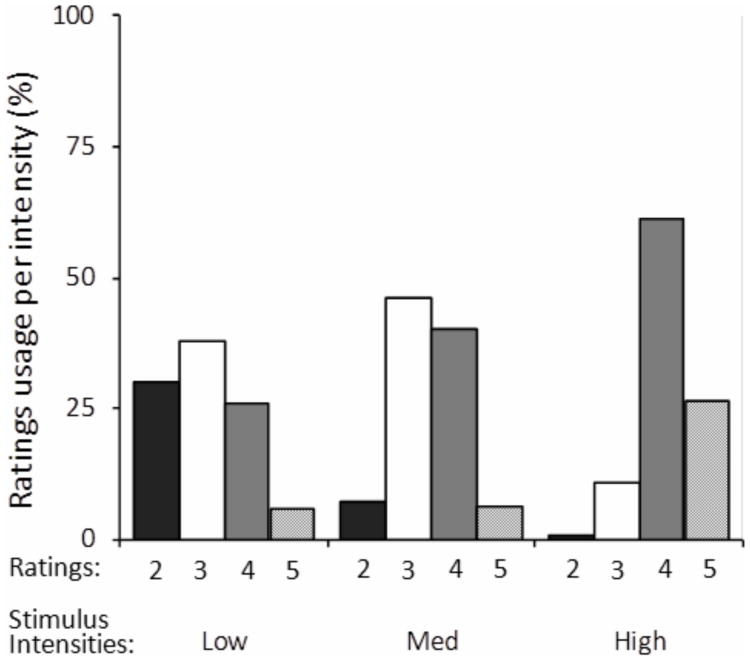
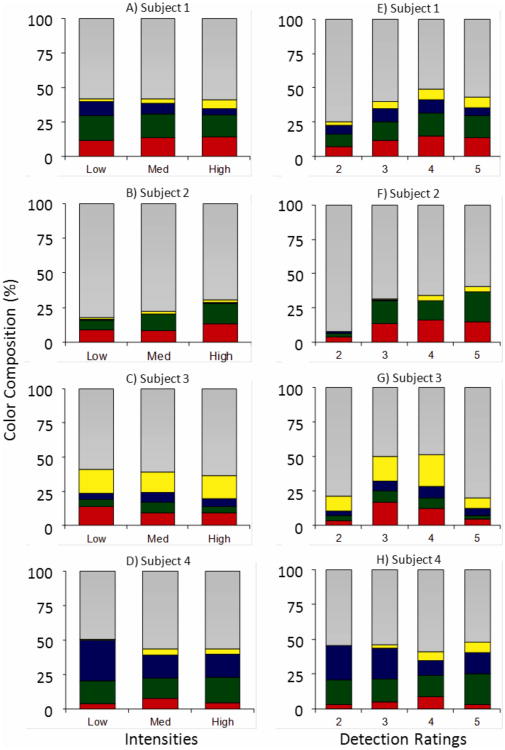
The application of adaptive optics to vision science creates the potential to directly probe the link between the retinal mosaic and visual perception. However, interrogation on a cellular level requires small, threshold stimuli and therefore an implicit detection model. Unfortunately the parameters governing detection at cone threshold are poorly constrained, and whether or not appearance judgments interact with detectability under these conditions is unknown. We tested the assumption that subjects can report stimulus appearance without compromising sensitivity by having four subjects rate either detection certainty, color appearance, or both, for small, brief, monochromatic (580 nm) point stimuli presented to the dark adapted fovea. Reporting color, either alone or in conjunction with detection certainty, did not impair detection. Sensitivity actually increased in the simultaneous reporting task, while color reports were effectively unaltered. These results suggest that 1. color mechanisms contain information relevant for detection at cone threshold, 2. subjects cannot voluntarily make full use of this information in a simple detection task, and 3. simultaneous reporting is a viable method of investigating multiple stimulus attributes for small threshold stimuli.


Conflict of interest statement

Conflicts of Interest: Darren E. Koenig, None; Heidi J. Hofer, None

Figures

Figure 1
Figure 1
Receiver Operating Characteristic (ROC) analysis and determination of discriminability, Δm. A) Typical ROC curves for Subject 1, from rating-only data. B) ROC curves for the same subject on a double probability plot and with a sample estimation of discriminability from linear fits to the low intensity curve −Δm equals z(S|n) on the ROC curve where z(S|s) equals zero (dashed lines). p(S|s) and p(S|n) are the correct detection and false positive rates, and z(S|s) and z(S|n) are their inverse normal distribution transformations. Here slopes fitting ROC data on double probability plots are less than one, as is expected with Poisson rather than Gaussian distributions. Gray line is a slope of one for comparison.
Figure 2
Figure 2
The Uniform Appearance Diagram showing typical color responses for one subject (Subject 1). Green-Red (ordinate) versus Yellow-Blue (abscissa) differences are plotted for all non-blank intensities (40-95% seen) reported with the color-only response scheme. Data has been arcsine transformed for uniform variance [25]. Boldness of the data points reflects the relative number of stimuli with the same color rating. Saturated hue responses fall along the outer perimeter and white responses fall at the origin. Background color is for illustrative purposes only.
Figure 3
Figure 3
There is no significant difference between detection thresholds in the detection-only (blue) and color-only (red) conditions. Detection-only thresholds are interpolated at the same false positive rate as employed in the color-only condition, error bars reflect the 95% confidence intervals estimated as described in the Methods.
Figure 4
Figure 4
(A) Detection thresholds are not higher in the simultaneous rating condition (green) than in the detection-only rating condition (blue), and are significantly lower for Subjects 2 and 4. To facilitate comparison with Fig. 3, thresholds in Fig. 4 are also interpolated at the color-only criterion, error bars reflect the 95% confidence intervals estimated as described in the Methods section. (B) On average, discriminability increases in the simultaneous rating condition compared with the detection-only condition. Ordinate is the percent change in discriminability between detection-only (Δmd) and simultaneous (Δms) rating conditions [100 × (Δmd - Δms)/Δmd]. Error bars are one standard error of the mean across subjects. The three leftmost bars are the mean across subjects at each intensity, and the rightmost bar is the overall mean across subjects and intensities.
Figure 5
Figure 5
(A) Detection thresholds are not significantly different in the simultaneous detection-size rating condition (green) than in the detection-only rating condition (blue). Error bars reflect the 95% confidence intervals estimated as described in the Methods section. (B) On average discriminability (Δm) was not significantly different between conditions for the 2 subjects. Ordinate is the percent change in discriminability between detection-only (Δmd) and simultaneous (Δms) rating conditions [100 × (Δmd - Δms)/Δmd]. Error bars are one standard error of the mean across subjects.
Figure 6
Figure 6
Color ratings averaged across sessions are not significantly different between the color-only condition (black) and simultaneous rating condition (white), except along the yellow-blue axis at high intensity for Subject 4 (arrows, panel D). This difference may be the result of the difference in sensitivity in the two conditions, which typically manifests along the yellow-blue axis. Error bars are one standard error of the mean of the arcsin transformed green-red and yellow-blue rating differences. The axes have been truncated to ± 5 to better display the average values. Background color is for illustrative purposes only. Data includes all seen stimuli (rated 2 or more in the simultaneous rating condition), and excludes false positive responses.
Figure 7
Figure 7
Typical variability in subjective ratings usage as a function of intensity. Subjective ratings for each intensity range from 2 (‘unsure’) to 5 (‘bright spot seen’). Data are from one simultaneous rating session (Subject 1). Stimuli of any intensity (Low, Med, High) may attain any subjective brightness.
Figure 8
Figure 8
Red, green, yellow, blue and white responses (corresponding color segments, except gray segments incorporate white, gray, or uncertain hue responses) as a proportion of total hue response for each nonzero stimulus intensity (Subjects 1-4, A-D), and each subjective detection criterion (Subjects 1-4, E-H). For subjects 1, 2 and 4 the proportion of yellow (blue) tends to increase (decrease) with increasing intensity, a trend toward veridical hue for a 580 nm stimulus.

References

    1. Young T. On the theory of light and colours. Phil Trans R Soc Lond. 1802;92:12–48.
    1. Roorda A, Williams DR. The arrangement of the three cone classes in the living human eye. Nature. 1999;387:520–522. - PubMed
    1. Hofer HJ, Carroll J, Neitz J, Neitz M, Williams DR. Organization of the human trichromatic cone mosaic. J Neurosci. 2005;25(42):9669–9679. - PMC - PubMed
    1. Williams DR. Advances in Photoreception: Proceedings of a Symposium on Frontiers of Visual Science. National Academy Press; 1990. The invisible cone mosaic; pp. 135–148. - PubMed
    1. Williams DR, Sekiguchi N, Haake W, Brainard D, Packer O. The cost of trichromacy for spatial vision. In: Valberg A, Lee BB, editors. From Pigments to Perception. Plenum Press; 1991. pp. 11–22.

Publication types