. 2012 Apr 1;82(5):e787-93.
doi: 10.1016/j.ijrobp.2011.11.030. Epub 2012 Feb 11.

Does local recurrence of prostate cancer after radiation therapy occur at the site of primary tumor? Results of a longitudinal MRI and MRSI study

Affiliations

Does local recurrence of prostate cancer after radiation therapy occur at the site of primary tumor? Results of a longitudinal MRI and MRSI study

Elnasif Arrayeh et al. Int J Radiat Oncol Biol Phys. .

Abstract

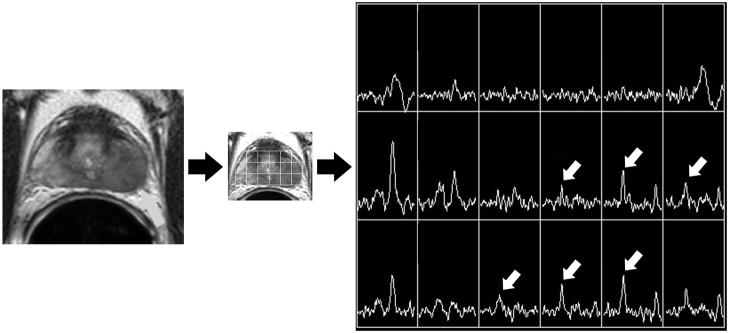
Purpose: To determine if local recurrence of prostate cancer after radiation therapy occurs at the same site as the primary tumor before treatment, using longitudinal magnetic resonance (MR) imaging and MR spectroscopic imaging to assess dominant tumor location.

Methods and materials: This retrospective study was HIPAA compliant and approved by our Committee on Human Research. We identified all patients in our institutional prostate cancer database (1996 onward) who underwent endorectal MR imaging and MR spectroscopic imaging before radiotherapy for biopsy-proven prostate cancer and again at least 2 years after radiotherapy (n = 124). Two radiologists recorded the presence, location, and size of unequivocal dominant tumor on pre- and postradiotherapy scans. Recurrent tumor was considered to be at the same location as the baseline tumor if at least 50% of the tumor location overlapped. Clinical and biopsy data were collected from all patients.

Results: Nine patients had unequivocal dominant tumor on both pre- and postradiotherapy imaging, with mean pre- and postradiotherapy dominant tumor diameters of 1.8 cm (range, 1-2.2) and 1.9 cm (range, 1.4-2.6), respectively. The median follow-up interval was 7.3 years (range, 2.7-10.8). Dominant recurrent tumor was at the same location as dominant baseline tumor in 8 of 9 patients (89%).

Conclusions: Local recurrence of prostate cancer after radiation usually occurs at the same site as the dominant primary tumor at baseline, suggesting supplementary focal therapy aimed at enhancing local tumor control would be a rational addition to management.


Conflict of interest statement

There is no conflict of interest to disclose.

Figures

Figure 1
Figure 1
Figure 1A. Photomontage of axial T2-weighted MR image, overlaid MR spectral grid, and corresponding MR spectra array in a 58 year old with recently diagnosed prostate cancer. A large mass-like focus (grey arrow) of reduced T2 signal intensity in the peripheral zone of the left mid-gland is associated with multiple voxels demonstrating high choline peaks (white arrows). This was considered the dominant tumor location. Figure 1B. Photomontage of axial T2-weighted MR image, overlaid MR spectral grid, and corresponding MR spectra array obtained 4 years later, after treatment with external beam radiotherapy. Reduced T2 signal intensity (grey arrow) in the peripheral zone of the left mid-gland is associated with multiple voxels demonstrating high choline peaks (white arrows). This was considered the dominant recurrent tumor location, and matches the dominant location seen at baseline imaging.
Figure 1
Figure 1
Figure 1A. Photomontage of axial T2-weighted MR image, overlaid MR spectral grid, and corresponding MR spectra array in a 58 year old with recently diagnosed prostate cancer. A large mass-like focus (grey arrow) of reduced T2 signal intensity in the peripheral zone of the left mid-gland is associated with multiple voxels demonstrating high choline peaks (white arrows). This was considered the dominant tumor location. Figure 1B. Photomontage of axial T2-weighted MR image, overlaid MR spectral grid, and corresponding MR spectra array obtained 4 years later, after treatment with external beam radiotherapy. Reduced T2 signal intensity (grey arrow) in the peripheral zone of the left mid-gland is associated with multiple voxels demonstrating high choline peaks (white arrows). This was considered the dominant recurrent tumor location, and matches the dominant location seen at baseline imaging.
Figure 2
Figure 2
Figure 2A. Photomontage of axial T2-weighted MR image, overlaid MR spectral grid, and corresponding MR spectra array in a 67 year old with recently diagnosed prostate cancer. A large mass-like focus (large hollow white arrow) of reduced T2 signal intensity in the left central gland is associated with isolated choline elevation (small hollow white arrow white arrow). Readers considered this the dominant tumor location. A second smaller focus (large grey arrow) of reduced T2 signal intensity in the peripheral zone of the left mid-gland associated with relative choline elevation (small grey arrow) was not considered the dominant tumor location. Figure 2B. Photomontage of axial T2-weighted MR image, overlaid MR spectral grid, and corresponding MR spectra array obtained 7 years later, after treatment with external beam radiotherapy. Reduced T2 signal intensity (large white arrow) in the peripheral zone of the left mid-gland is associated with high choline peaks (small white arrows). This was considered the dominant recurrent tumor location. This does not match the dominant location seen at baseline imaging, but in retrospect does correspond to the secondary tumor focus seen in Figure 2A.
Figure 2
Figure 2
Figure 2A. Photomontage of axial T2-weighted MR image, overlaid MR spectral grid, and corresponding MR spectra array in a 67 year old with recently diagnosed prostate cancer. A large mass-like focus (large hollow white arrow) of reduced T2 signal intensity in the left central gland is associated with isolated choline elevation (small hollow white arrow white arrow). Readers considered this the dominant tumor location. A second smaller focus (large grey arrow) of reduced T2 signal intensity in the peripheral zone of the left mid-gland associated with relative choline elevation (small grey arrow) was not considered the dominant tumor location. Figure 2B. Photomontage of axial T2-weighted MR image, overlaid MR spectral grid, and corresponding MR spectra array obtained 7 years later, after treatment with external beam radiotherapy. Reduced T2 signal intensity (large white arrow) in the peripheral zone of the left mid-gland is associated with high choline peaks (small white arrows). This was considered the dominant recurrent tumor location. This does not match the dominant location seen at baseline imaging, but in retrospect does correspond to the secondary tumor focus seen in Figure 2A.

References

    1. American Cancer Society. Cancer Facts & Figures 2010. Atlanta: American Cancer Society; 2010. p. 23.
    1. Pouliot J, Kim Y, Lessard E, et al. Inverse planning for HDR prostate brachytherapy used to boost dominant intraprostatic lesions defined by magnetic resonance spectroscopy imaging. Int J Radiat Oncol Biol Phys. 2004;59:1196–1207. - PubMed
    1. van Lin EN, Futterer JJ, Heijmink SW, et al. IMRT boost dose planning on dominant intraprostatic lesions: Gold marker–based three-dimensional fusion of CT with dynamic contrast-enhanced and 1H-spectroscopic MRI. Int J Radiat Oncol Biol Phys. 2006;65:291–303. - PubMed
    1. Zelefsky MJ, Cohen G, Zakian KL, et al. Intraoperative conformal optimization for transperineal prostate implantation using magnetic resonance spectroscopic imaging. Cancer J. 2000;6:249–255. - PubMed
    1. Xia P, Pickett B, Vigneault E, et al. Forward or inversely planned segmental multileaf collimator IMRT and sequential tomotherapy to treat multiple dominant intraprostatic lesions of prostate cancer to 90 Gy. Int J Radiat Oncol Biol Phys. 2001;51:244–254. - PubMed

Publication types