. 2012 Jul;20(7):1403-12.
doi: 10.1038/oby.2012.36. Epub 2012 Feb 14.

Simultaneous measurement of insulin sensitivity, insulin secretion, and the disposition index in conscious unhandled mice

Affiliations

Simultaneous measurement of insulin sensitivity, insulin secretion, and the disposition index in conscious unhandled mice

Laura C Alonso et al. Obesity (Silver Spring). 2012 Jul.

Abstract

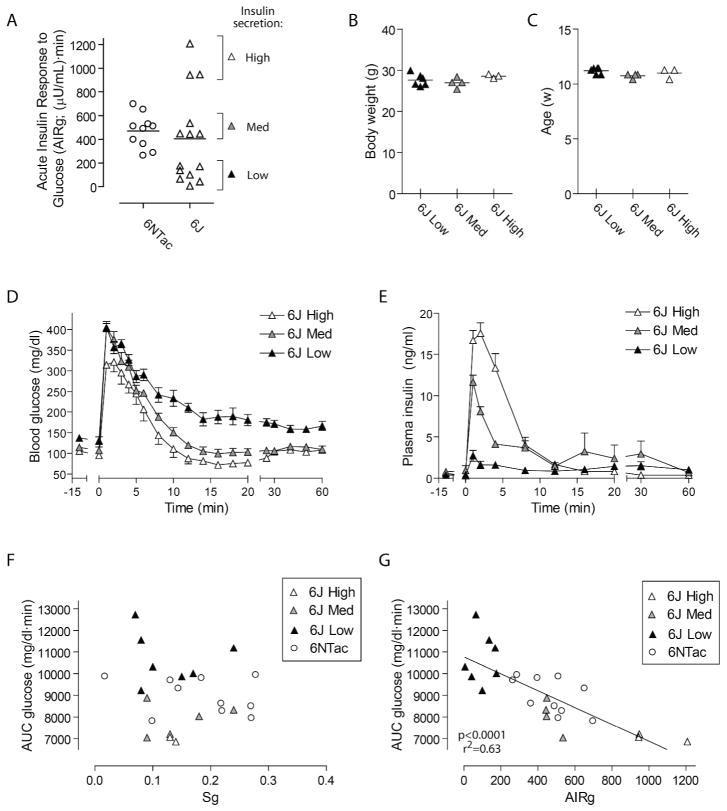
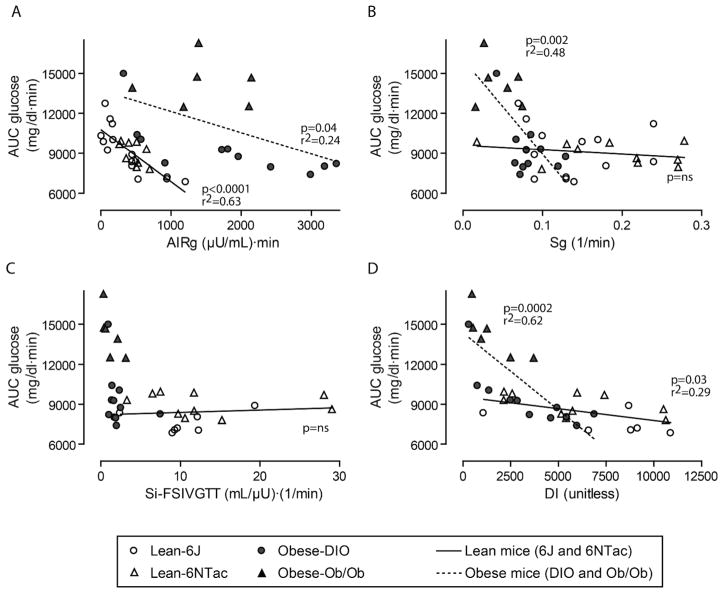
Of the parameters that determine glucose disposal and progression to diabetes in humans: first-phase insulin secretion, glucose effectiveness (Sg), insulin sensitivity (Si), and the disposition index (DI), only Si can be reliably measured in conscious mice. To determine the importance of the other parameters in murine glucose homeostasis in lean and obese states, we developed the frequently sampled intravenous glucose tolerance test (FSIVGTT) for use in unhandled mice. We validated the conscious FSIVGTT against the euglycemic clamp for measuring Si in lean and obese mice. Insulin-resistant mice had increased first-phase insulin secretion, decreased Sg, and a reduced DI, qualitatively similar to humans. Intriguingly, although insulin secretion explained most of the variation in glucose disposal in lean mice, Sg and the DI more strongly predicted glucose disposal in obese mice. DI curves identified individual diet-induced obese (DIO) mice as having compensated or decompensated insulin secretion. Conscious FSIVGTT opens the door to apply mouse genetics to the determinants of in vivo insulin secretion, Sg, and DI, and further validates the mouse as a model of metabolic disease.


Conflict of interest statement

Conflict of interest statement:

The authors declare no conflicts of interest with this work.

Figures

Figure 1
Figure 1. FSIVGTT glucose and insulin curves are rapid and reproducible in conscious lean mice
Based on pilot data (not shown), the blood sampling protocol (A) was designed to accurately represent glucose and insulin curves while minimizing sampling frequency. (B–C) FSIVGTT was performed on C57BL/6NTac mice (6NTac; n=10). Shown are blood glucose (B) and plasma insulin (C) as a function of time. Note the extremely rapid return to baseline by 15 minutes after IV glucose bolus. (D–E) The FSIVGTT protocol was applied to a second inbred strain, C57BL/6J (6J; n=14). Note the reproducibility of data in similar lean strains. 6NTac curves are re-plotted in (D–E) to facilitate comparison. Data are represented as mean ± s.e.m.
Figure 2
Figure 2. In conscious mice, FSIVGTT-derived insulin sensitivity is comparable to gold-standard hyperinsulinemic euglycemic clamp
FSIVGTT performed in Ob/Ob mice revealed higher peak blood glucose than lean mice, with slower decay (A), as well as elevated basal and peak plasma insulin (B). Insulin sensitivity measurements obtained from hyperglycemic euglycemic clamp (C) or FSIVGTT (D) were similar. To confirm this finding in a second model of insulin resistance, FSIVGTT was performed in mice with diet induced obesity (E–F). DIO mice showed increased peak blood glucose with a rapid return to baseline; first phase insulin secretion was markedly increased in DIO mice relative to lean mice. Insulin sensitivity measurements obtained by hyperinsulinemic euglycemic clamp (G) and FSIVGTT (H) in DIO mice were similar. Lean controls in panels A, B, D, E, F and H include the seven lean mice from Figure 1 with sufficient insulin secretion to model Si-FSIVGTT (6J-High and 6J-Med from Figure 3 below). Data are represented as mean ± s.e.m.
Figure 3
Figure 3. Glucose disposal in conscious mice is dependent on first phase insulin secretion
(A) 6J mice showed widely variable AIRg relative to 6NTac mice. 6J mice were separated into three groups based on AIRg <200 (Low), 200–600 (Med) or >600 (High). (B–C) The variability in insulin secretion was not due to differences in mouse body weight (B) or age (C). FSIVGTT blood glucose curves (D) showed that mice with High AIRg had the fastest glucose disposal, while mice with Low AIRg had delayed glucose disposal. (E) FSIVGTT insulin curves illustrate the marked variability in insulin secretion among 6J mice, and demonstrate the consistency among measurements over time for each group. (F–G) For lean mice, AUC glucose was unrelated to Sg (F) but was tightly correlated with AIRg (G). Data for (D–E) are represented as mean ± s.e.m.
Figure 4
Figure 4. Obese mice with IGT have increased first-phase insulin secretion but reduced glucose effectiveness relative to lean mice
Modeling FSIVGTT glucose and insulin curves to quantify first-phase insulin secretion (AIRg) and glucose effectiveness (Sg) revealed that DIO and Ob/Ob mice had increased AIRg (A) and reduced Sg (B) compared with lean mice. Data are represented as mean ± s.e.m.
Figure 5
Figure 5. Variation in glucose disposal is predominantly determined by insulin secretion in lean mice, but by Sg and DI in obese mice
(A) In lean mice, AIRg was significantly correlated with AUC glucose; in obese mice, variation in AIRg accounted for less of the variation in glucose disposal. (B) Sg variation over a wide range was unrelated to AUC glucose in lean mice, but strongly predicted glucose disposal in obese mice. (C–D) On its own, Si did not account for variation in AUC glucose for either lean or obese mice, but DI, the product of Si and AIRg, predicted AUC glucose across the entire cohort of mice (p<0.0001, r2=0.46, curve not shown), attributable to a strong effect in obese mice. Data shown in (C–D) exclude 6J mice with insufficient insulin secretion to model insulin sensitivity. When DIO and Ob/Ob groups were analyzed separately for these parameters, significant correlations were observed for AIRg (A): DIO (p=0.01, r2=0.50), and DI (D): Ob/Ob (p=0.05, r2=0.65) and DIO (p=0.005, r2=0.60); all other correlations were non-significant.
Figure 6
Figure 6. Disposition index curves identify individual DIO mice as metabolically compensated or decompensated
(A) AIRg expressed as a function of Si for all mice showed a roughly hyperbolic relationship between these parameters. Comparing average DI for the lean versus obese groups (B) showed that DI was markedly lower in Ob/Ob mice, with an intermediate phenotype in DIO mice. (C) Hyperbolic DI curves were defined using data from lean mice (compensated; solid curve) and Ob/Ob mice (decompensated; dashed curve). The mean DI for each group is plotted. When DIO mice were individually plotted against these curves (D), the DIO cohort was split, with some mice falling near the compensated curve, and others near the decompensated curve.

References

    1. Berglund ED, Li CY, Poffenberger G, Ayala JE, Fueger PT, Willis SE, et al. Glucose metabolism in vivo in four commonly used inbred mouse strains. Diabetes. 2008 Jul;57(7):1790–9. - PMC - PubMed
    1. Kim JK, Zisman A, Fillmore JJ, Peroni OD, Kotani K, Perret P, et al. Glucose toxicity and the development of diabetes in mice with muscle-specific inactivation of GLUT4. J Clin Invest. 2001 Jul;108(1):153–60. - PMC - PubMed
    1. Kulkarni RN, Almind K, Goren HJ, Winnay JN, Ueki K, Okada T, et al. Impact of genetic background on development of hyperinsulinemia and diabetes in insulin receptor/insulin receptor substrate-1 double heterozygous mice. Diabetes. 2003 Jun;52(6):1528–34. - PubMed
    1. Lillioja S, Mott DM, Spraul M, Ferraro R, Foley JE, Ravussin E, et al. Insulin resistance and insulin secretory dysfunction as precursors of non-insulin-dependent diabetes mellitus. Prospective studies of Pima Indians. N Engl J Med. 1993 Dec 30;329(27):1988–92. - PubMed
    1. Weyer C, Bogardus C, Mott DM, Pratley RE. The natural history of insulin secretory dysfunction and insulin resistance in the pathogenesis of type 2 diabetes mellitus. J Clin Invest. 1999 Sep;104(6):787–94. - PMC - PubMed

Publication types