Comparative Study
. 2012 Mar;129(3):e748-55.
doi: 10.1542/peds.2011-2067. Epub 2012 Feb 13.

Nonconvulsive status epilepticus: the encephalopathic pediatric patient

Affiliations
Comparative Study

Nonconvulsive status epilepticus: the encephalopathic pediatric patient

Hansel M Greiner et al. Pediatrics. 2012 Mar.

Abstract

Objective: A high prevalence of nonconvulsive status epilepticus (NCSE) has been reported in critically ill adults and neonates. Recent prospective pediatric studies focus on critically ill children and show wide variability in the frequency of NCSE. This study examines prevalence of pediatric NCSE regardless of inpatient setting and retrospectively identifies risk factors indicating a need for urgent continuous EEG.

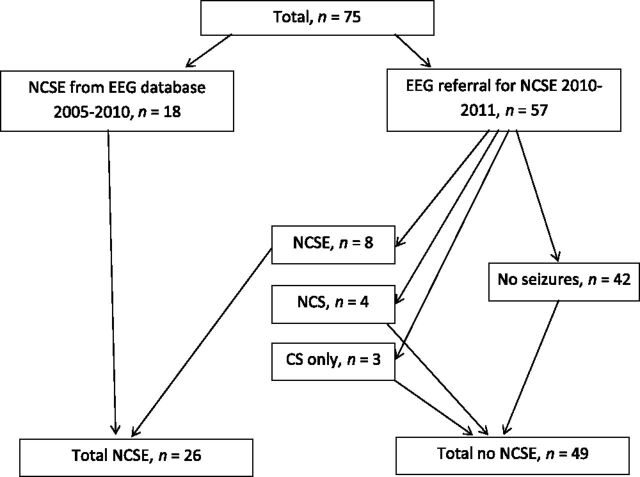
Methods: Medical records from patients aged 3 months to 21 years were identified either by (1) searching a clinical EEG database (n = 18) or (2) consecutive inpatient EEG referrals for NCSE over an 8-month period (n = 57).

Results: Seventy-five children, mean age of 7.8 years, were studied. NCSE was identified in 26 patients (35%) and in 8 of 57 (14%) patients referred for possible NCSE. More than half of the patients referred were outside of the ICU. A witnessed clinical seizure was observed in 24 of 26 (92%) patients with NCSE. Acute cortical neuroimaging abnormalities were significantly more frequent in patients with NCSE. The presence of clinical seizures and acute neuroimaging abnormality was associated with an 82% probability of NCSE. All but 1 patient with NCSE had electrographic or electroclinical seizures within the first hour of monitoring.

Conclusions: A high prevalence of NCSE was observed, comparable to adult studies, but within a wider range of inpatient settings. Children with acute encephalopathy should undergo continuous EEG. This evaluation is more urgent if certain clinical risk factors are present. Optimal duration of monitoring and the effect of NCSE on prognosis should be studied.


Conflict of interest statement

FINANCIAL DISCLOSURE: The authors have indicated they have no financial relationships relevant to this article to disclose.

Figures

FIGURE 1. Patient distribution. Eighteen patients with NCSE were identified by searching an EEG database and 57 by monitoring consecutive EEG referrals for NCSE. Eight of them had NCSE. Additionally, 4 had nonconvulsive seizures (NCS) and 3 had convulsive seizures (CS) only, demonstrated on video EEG.
FIGURE 1
Patient distribution. Eighteen patients with NCSE were identified by searching an EEG database and 57 by monitoring consecutive EEG referrals for NCSE. Eight of them had NCSE. Additionally, 4 had nonconvulsive seizures (NCS) and 3 had convulsive seizures (CS) only, demonstrated on video EEG.
FIGURE 2. EEG showing SE. Standard 10-20 system EEG in average referential montage display, demonstrating rhythmic sharps and δ frequency ictal activity maximal in the left frontal region. Patient was a 2-year-old girl with cardiopulmonary arrest secondary to pulmonary hemorrhage. She became less responsive several days after her arrest. An MRI demonstrated multifocal cortical signal abnormalities consistent with cerebral edema. This EEG was obtained, and a diagnosis of NCSE was made. She was eventually stabilized but on follow-up had significant neurologic impairment.
FIGURE 2
EEG showing SE. Standard 10-20 system EEG in average referential montage display, demonstrating rhythmic sharps and δ frequency ictal activity maximal in the left frontal region. Patient was a 2-year-old girl with cardiopulmonary arrest secondary to pulmonary hemorrhage. She became less responsive several days after her arrest. An MRI demonstrated multifocal cortical signal abnormalities consistent with cerebral edema. This EEG was obtained, and a diagnosis of NCSE was made. She was eventually stabilized but on follow-up had significant neurologic impairment.
FIGURE 3. A 2-year-old boy with new-onset seizures and sepsis. History of previous white matter injury of prematurity and intraventricular hemorrhage. Shunt dependent hydrocephalus. L-R: Axial fluid attenuated inversion recovery image, axial diffusion-weighted image, and apparent diffusion coefficient map. A, At acute clinical presentation. Note the extensive edema and gyral swelling throughout the left hemisphere on the fluid attenuated inversion recovery sequence (arrows). Increased signal is also noted involving the left thalami and basal ganglia. Trace diffusion-weighted image map demonstrates extensive increased signal throughout the left hemisphere. Apparent diffusion coefficient map demonstrates left hemispheric diffusion restriction involving both the cortex and white matter. Follow-up imaging (1 month later) demonstrates diffuse left hemispheric volume loss and evolution of diffusion changes. Clinically, he had acute flaccid right hemiplegia. At 6-month follow-up, he was improved but continued to have persistent spastic right hemiparesis. Language developmental milestones were normal.
FIGURE 3
A 2-year-old boy with new-onset seizures and sepsis. History of previous white matter injury of prematurity and intraventricular hemorrhage. Shunt dependent hydrocephalus. L-R: Axial fluid attenuated inversion recovery image, axial diffusion-weighted image, and apparent diffusion coefficient map. A, At acute clinical presentation. Note the extensive edema and gyral swelling throughout the left hemisphere on the fluid attenuated inversion recovery sequence (arrows). Increased signal is also noted involving the left thalami and basal ganglia. Trace diffusion-weighted image map demonstrates extensive increased signal throughout the left hemisphere. Apparent diffusion coefficient map demonstrates left hemispheric diffusion restriction involving both the cortex and white matter. Follow-up imaging (1 month later) demonstrates diffuse left hemispheric volume loss and evolution of diffusion changes. Clinically, he had acute flaccid right hemiplegia. At 6-month follow-up, he was improved but continued to have persistent spastic right hemiparesis. Language developmental milestones were normal.

Similar articles

Cited by

References

    1. Shorvon S , Baulac M , Cross H , Trinka E , Walker M TaskForce on Status Epilepticus of the ILAE Commission for European Affairs . The drug treatment of status epilepticus in Europe: consensus document from a workshop at the first London Colloquium on Status Epilepticus. Epilepsia. 2008;49(7):1277–1285 - PubMed
    1. Walker M , Cross H , Smith S , et al. . Nonconvulsive status epilepticus: Epilepsy Research Foundation workshop reports. Epileptic Disord. 2005;7(3):253–296 - PubMed
    1. Claassen J , Hirsch LJ , Frontera JA , et al. . Prognostic significance of continuous EEG monitoring in patients with poor-grade subarachnoid hemorrhage. Neurocrit Care. 2006;4(2):103–112 - PubMed
    1. Shneker BF , Fountain NB . Assessment of acute morbidity and mortality in nonconvulsive status epilepticus. Neurology. 2003;61(8):1066–1073 - PubMed
    1. Pisani F , Sisti L , Seri S . A scoring system for early prognostic assessment after neonatal seizures. Pediatrics. 2009;124(4). Available at: www.pediatrics.org/cgi/content/full/124/4/e580 - PubMed

Publication types

MeSH terms

Substances