. 2012 Jan 15;125(Pt 2):350-61.
doi: 10.1242/jcs.089177. Epub 2012 Feb 13.

Interconnected contribution of tissue morphogenesis and the nuclear protein NuMA to the DNA damage response

Affiliations

Interconnected contribution of tissue morphogenesis and the nuclear protein NuMA to the DNA damage response

Pierre-Alexandre Vidi et al. J Cell Sci. .

Abstract

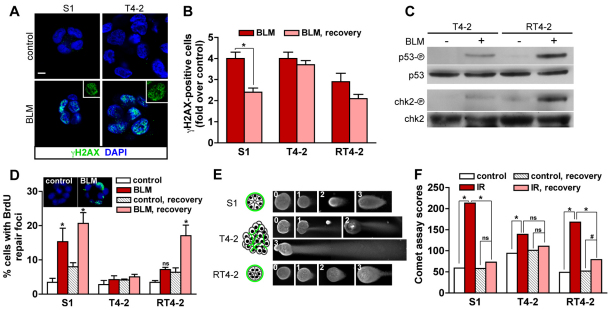
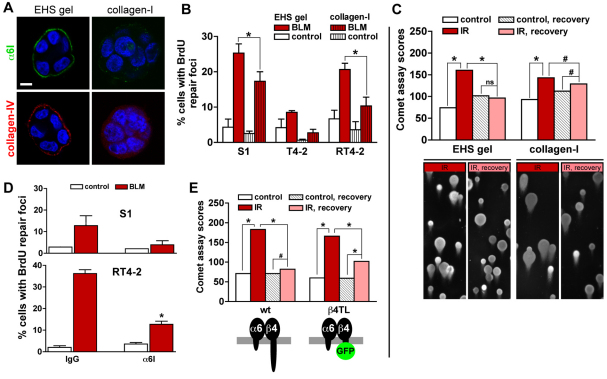
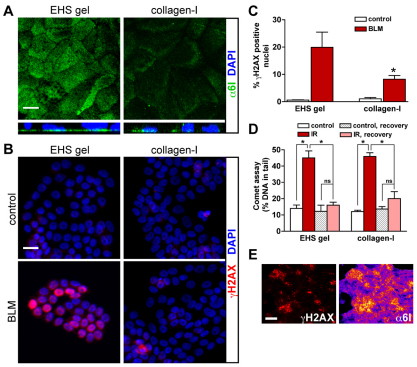
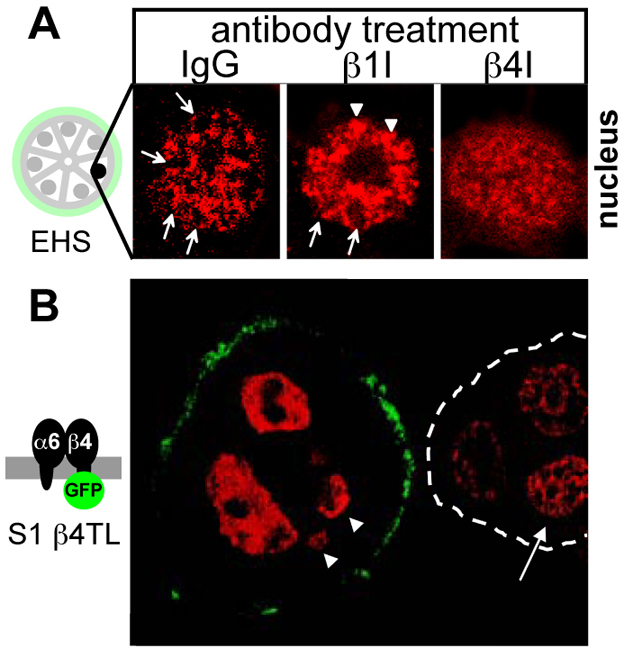
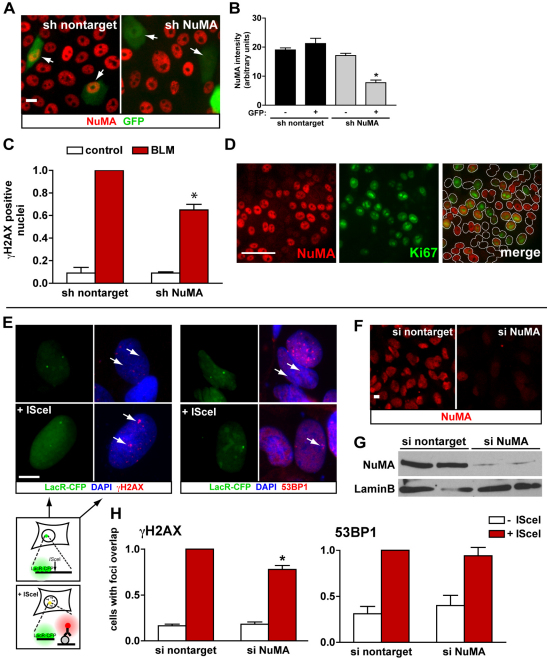
Epithelial tissue morphogenesis is accompanied by the formation of a polarity axis--a feature of tissue architecture that is initiated by the binding of integrins to the basement membrane. Polarity plays a crucial role in tissue homeostasis, preserving differentiation, cell survival and resistance to chemotherapeutic drugs among others. An important aspect in the maintenance of tissue homeostasis is genome integrity. As normal tissues frequently experience DNA double-strand breaks (DSBs), we asked how tissue architecture might participate in the DNA damage response. Using 3D culture models that mimic mammary glandular morphogenesis and tumor formation, we show that DSB repair activity is higher in basally polarized tissues, regardless of the malignant status of cells, and is controlled by hemidesmosomal integrin signaling. In the absence of glandular morphogenesis, in 2D flat monolayer cultures, basal polarity does not affect DNA repair activity but enhances H2AX phosphorylation, an early chromatin response to DNA damage. The nuclear mitotic apparatus protein 1 (NuMA), which controls breast glandular morphogenesis by acting on the organization of chromatin, displays a polarity-dependent pattern and redistributes in the cell nucleus of basally polarized cells upon the induction of DSBs. This is shown using high-content analysis of nuclear morphometric descriptors. Furthermore, silencing NuMA impairs H2AX phosphorylation--thus, tissue polarity and NuMA cooperate to maintain genome integrity.


Figures

Fig. 1.
Fig. 1.
DNA strand break repair in 3D culture. S1 cells, T4-2 cells and RT4-2 cells (T4-2 cells having undergone phenotypic reversion) were cultured in 3D in the presence of EHS gel (Matrigel) before induction of DSBs. (A) Immunostaining for γH2AX in S1 acini and T4-2 nodules treated either with bleomycin (BLM) or with vehicle (control) for 2 hours. Nuclei are counterstained with DAPI. γH2AX is shown alone in representative nuclei (insets). Scale bar, 5 μm. (B) Quantification of γH2AX-positive cells in S1 acini, T4-2 nodules and RT4-2 spheroids directly after a 2-hour treatment (BLM) and following a 24-hour recovery period in BLM-free medium (BLM, recovery). Results were normalized to vehicle-treated cells. *P<0.01, unpaired t-test, n=3. (C) Western blots for phosphorylated p53 (Ser 15), p53, phosphorylated chk2 (Thr 68) and chk2 in T4-2 nodules and RT4-2 spheroids after a 2-hour treatment with BLM or with vehicle. (D) Percentages of cells with repair foci detected by BrdU labeling, see B for treatment. Confocal images of BrdU signal (green) and of the DAPI counterstain (blue) are shown for control and BLM-treated (BLM) S1 acini. *P<0.01 compared with controls, Bonferroni, n=3. (E) Representative images illustrating the four grades (0, 1, 2 and 3) used for the analysis of comet assays with 3D multicellular structures. Larger T4-2 nodules are displayed at half the scale used for S1 acini and RT4-2 spheroids. Drawings represent the organization of the multicellular structures, with the typical distribution of basal polarity markers shown in green. (F) Comet assay scores for S1 acini, T4-2 nodules and RT4-2 spheroids after exposure to 3 Gy of gamma ionizing radiation (IR), directly after IR and after a 2-hour recovery period. *P<0.0001 and #P<0.001, Chi-square, n≥75, two independent biological replicates.
Fig. 2.
Fig. 2.
Basement membrane signaling increases DSB repair in 3D culture. (A) Immunostaining for basal markers α6-integrin (α6I) and collagen-IV in S1 multicellular structures embedded in EHS or in collagen-I gels. Scale bar, 5 μm. (B) Percentages of cells with repair foci measured by BrdU labeling in 3D EHS gel and collagen-I cultures treated with either BLM or vehicle (control). *P<0.05, Bonferroni (n=3). Of note, no significant difference was measured for basal (control) conditions between the different cell types. (C) Comet assay scores for S1 multicellular structures formed either in EHS gel or in collagen-I and exposed to 3 Gy of gamma ionizing radiation (IR). Comet tails were scored directly after IR and also after a 2-hour recovery period. Controls were mock irradiated. *P<0.0001 and #P<0.05, Chi-square, n≥188, two independent biological replicates. Representative comet images are shown. (D) Percentages of cells with repair foci in S1 acini and RT4-2 spheroids incubated with either function-blocking α6-integrin antibody or immunoglobulin (IgG) before treatment with BLM. *P<0.05 compared with IgG, Tukey, n=3. (E) Comet assay scores for acini formed by wild-type (wt) S1 cells and S1 cells expressing a truncated form of β4-integrin fused to GFP (β4TL). Cells were treated as in C. *P<0.0001 and #P<0.001, n≥293, four independent biological replicates. ns, no significant difference.
Fig. 3.
Fig. 3.
Basal polarity influences H2AX phosphorylation but not DSB repair in flat monolayers of cells. S1 cells were seeded on dried EHS (which induces basal polarity) and dried collagen-I gels (which does not induce polarity) to form flat monolayers of cells (2D culture). (A) Immunostaining for α6-integrin (α6I). Maximal-intensity projections (top panels) and orthogonal views of confocal z-stacks (bottom panels) are shown. (B) Immunostaining for γH2AX in cell cultures treated with either BLM or vehicle (control). Nuclei are counterstained with DAPI (A,B). (C) Percentages of γH2AX-positive nuclei in cell cultures treated as in B. *P<0.05, Bonferroni, n=3. (D) Measurement of DSBs following either 3 Gy of gamma ionizing radiation (IR) or mock irradiation (control) using comet assays performed directly after irradiation or after a 2-hour recovery period. *P<0.001, Bonferroni, n=4. (E) Immunostaining for γH2AX (left) and α6-integrin (right) in S1 cells cultured on dried EHS and treated with BLM. Signals for α6-integrin are displayed with ‘Fire’ LUT to visualize signal intensity. Scale bars, 10 μm (A), 20 μm (B) and 200 μm (E). ns, no significant difference.
Fig. 4.
Fig. 4.
Plasticity of distribution in acini. (A) Immunostaining for NuMA in S1 acini treated with function-blocking antibodies against β1- and β4-integrins, and with nonspecific IgG from days 10 to 16 of 3D culture. Images represent single nuclei. Arrows point to NuMA staining in distinct foci that are often organized into rings and that are typically found upon acinar differentiation; arrowheads point to larger NuMA foci also often seen in the nuclei of acinar cells. (B) Immunostaining for NuMA (red) in S1 acinar cells expressing a truncated β4-integrin fused to GFP (β4TL) that is localized at the basal side of the acinus (green). Arrowheads point to nuclei that are partially out of the image plane. An adjacent acinus lacking β4TL expression (white broken line) is shown for comparison. The arrow points to a nucleus with distinct NuMA staining foci, which are typical of differentiated cells.
Fig. 5.
Fig. 5.
NuMA responds to DSBs. (A) NuMA immunostaining in S1 cells in 3D culture in either EHS or collagen-I gels and treated with BLM or with vehicle (control). The arrowhead indicates NuMA accumulation in DNA-poor regions. All nuclei are indicated by dotted lines. DAPI staining and merged images for single nuclei are shown in the insets and correspond to the nuclei with white dotted lines. Scale bar, 5 μm. (B) Quantitative analysis of NuMA immunostaining signals using Haralick texture descriptors reduced to a 3D composite feature space with principal-component analysis. High sensitivity and high specificity values indicate optimal classification. (C) NuMA distribution in flat monolayers of S1 cells on dried EHS or on dried collagen-I after BLM or vehicle treatments. Scale bar, 5 μm. Morphometric descriptors (D,E) and Haralick texture descriptors (F) derived from NuMA staining are used to compare NuMA distributions. In E, BLM-treated cells on EHS and collagen-I substrates are compared with a fused control group consisting of vehicle-treated cells from EHS and collagen-I cultures.
Fig. 6.
Fig. 6.
NuMA influences H2AX phosphorylation. (A) Immunostaining for NuMA (red) in S1 cells expressing either shRNA targeting NuMA or scrambled shRNA (nontarget), as well as GFP. Arrows indicate cells with GFP signals. (B) Quantification of NuMA fluorescence signals in microscopy images. *P<0.001, Tukey, n>20 nuclei from two biological replicates. (C) Quantification of γH2AX prevalence in GFP-positive S1 cells transfected with nontargeting shRNA constructs or with NuMA-specific shRNA constructs after treatment with either BLM or vehicle (control). Data are normalized to BLM-treated cells transfected with nontargeting shRNAs. *P<0.05, one-sample t-test, n=3. (D) Dual NuMA–Ki67 immunostaining in S1 cells transfected with siRNAs targeting NuMA. The white lines in the merged image distinguish individual nuclei. (E–H) U2OS cells with stable genomic integrations of the I-SceI restriction site flanked by Lac repeats were used to visualize γH2AX and 53BP1 at broken DNA ends. (E) Detection of Lac arrays after transient expression of LacR–CFP (green) and immunostaining for γH2AX (red, left panel) and 53BP1 (red, right panel). DSBs were induced by I-SceI expression. Arrows point to the location of LacR–CFP. These representative fluorescence images are shown adjacent to the schematic of the experiment, in which the I-SceI site and flanking Lac array are enlarged. (F) Immunostaining and (G) western blot analysis of NuMA in U2OS cells transfected with either nontargeting or NuMA-targeting siRNAs. (H) Quantification of H2AX phosphorylation (left panel) and recruitment of 53BP1 (right panel) at DSBs. Values are expressed relative to cells expressing both I-SceI and nontargeting siRNAs. *P=0.001, one-sample t-test, n≥5. Scale bars, 10 μm.

Similar articles

Cited by

References

    1. Abad P. C., Lewis J., Mian I. S., Knowles D. W., Sturgis J., Badve S., Xie J., Lelièvre S. A. (2007). NuMA influences higher order chromatin organization in human mammary epithelium. Mol. Biol. Cell 18, 348-361 - PMC - PubMed
    1. Ayoub N., Jeyasekharan A. D., Bernal J. A., Venkitaraman A. R. (2008). HP1-beta mobilization promotes chromatin changes that initiate the DNA damage response. Nature 453, 682-686 - PubMed
    1. Balajee A. S., Geard C. R. (2001). Chromatin-bound PCNA complex formation triggered by DNA damage occurs independent of the ATM gene product in human cells. Nucleic Acids Res. 29, 1341-1351 - PMC - PubMed
    1. Barcellos-Hoff M. H. (1998). The potential influence of radiation-induced micro-environments in neoplastic progression. J. Mammary Gland Biol. Neoplasia 3, 165-175 - PubMed
    1. Beliveau A., Mott J. D., Lo A., Chen E. I., Koller A. A., Yaswen P., Muschler J., Bissell M. J. (2010). Raf-induced MMP9 disrupts tissue architecture of human breast cells in three-dimensional culture and is necessary for tumor growth in vivo. Genes Dev. 24, 2800-2811 - PMC - PubMed

Publication types

MeSH terms