. 2012 Apr;32(8):1396-407.
doi: 10.1128/MCB.06113-11. Epub 2012 Feb 13.

A role for sphingomyelin-rich lipid domains in the accumulation of phosphatidylinositol-4,5-bisphosphate to the cleavage furrow during cytokinesis

Affiliations

A role for sphingomyelin-rich lipid domains in the accumulation of phosphatidylinositol-4,5-bisphosphate to the cleavage furrow during cytokinesis

Mitsuhiro Abe et al. Mol Cell Biol. 2012 Apr.

Abstract

Cytokinesis is a crucial step in the creation of two daughter cells by the formation and ingression of the cleavage furrow. Here, we show that sphingomyelin (SM), one of the major sphingolipids in mammalian cells, is required for the localization of phosphatidylinositol-4,5-bisphosphate (PIP(2)) to the cleavage furrow during cytokinesis. Real-time observation with a labeled SM-specific protein, lysenin, revealed that SM is concentrated in the outer leaflet of the furrow at the time of cytokinesis. Superresolution fluorescence microscopy analysis indicates a transbilayer colocalization between the SM-rich domains in the outer leaflet and PIP(2)-rich domains in the inner leaflet of the plasma membrane. The depletion of SM disperses PIP(2) and inhibits the recruitment of the small GTPase RhoA to the cleavage furrow, leading to abnormal cytokinesis. These results suggest that the formation of SM-rich domains is required for the accumulation of PIP(2) to the cleavage furrow, which is a prerequisite for the proper translocation of RhoA and the progression of cytokinesis.


Figures
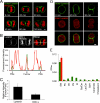
Fig 1
Fig 1
SM-rich domains are concentrated in the outer leaflet of the cleavage furrow. (A) SM is concentrated in the cleavage furrow. HeLa cells stably expressing histone H2B-DsRed (red) were stained with EGFP-lysenin (green). The pictures were taken at the indicated times. Bar, 5 μm. (B) DiIC18 is evenly distributed on the plasma membrane. The upper portion shows HeLa cells stably expressing histone H2B-DsRed (red) stained with EGFP-lysenin (green) and DiIC18 (red). (C) Quantitative analysis of fluorescence intensity. The fluorescence intensity of EGFP-lysenin and DiIC18 was measured in the cleavage furrow and the polar membrane. The intensities were normalized to the intensity at the polar region. Data are means ± SD (n > 20). (D) SM-rich domains are localized in the outer leaflet of the cleavage furrow. HeLa cells stably expressing mCherry-lysenin (red) were incubated with purified EGFP-lysenin (green). Bar, 5 μm. (E) EGFP-lysenin and mCherry-lysenin bind specifically to SM. Purified protein of EGFP-lysenin from E. coli (green) and cell lysate of HeLa cells expressing mCherry-lysenin (red) were assayed for ELISA. Data are means ± SD (n = 3).
Fig 2
Fig 2
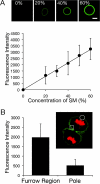
Estimation of the concentration of SM at the cleavage furrow. (A) Fluorescence intensity of EGFP-lysenin in giant unilamellar vesicles (GUVs). GUVs containing several concentrations of palmitoyl SM (0 to 60%) and egg PC were made and stained with EGFP-lysenin. Fluorescence intensity was measured at 37°C. Data are means ± SD (n > 15). Bar, 5 μm. (B) Fluorescence intensity of EGFP-lysenin in cells. HeLa cells stably expressing histone H2B-DsRed (red) were stained with EGFP-lysenin (green). The fluorescence intensity of EGFP-lysenin was measured around the furrow region (square) and the polar region (circle). Data are means ± SD (n > 50).
Fig 3
Fig 3
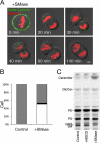
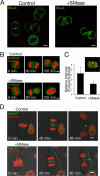
SM is required for proper cytokinesis. (A) Depletion of SM results in regression of the cleavage furrow. HeLa cells stably expressing histone H2B-DsRed (red) were stained with EGFP-lysenin (green). The cells were incubated in the presence of SMase. Bar, 5 μm. (B) Quantification of the phenotype. Cells were observed for 3 h (n > 30) and classified into 3 groups. Gray, black, and white colors indicate cells with normal cytokinesis, cells without nuclear division, and cells with a regressed furrow, respectively. (C) SMase treatment decreases the amount of SM in HeLa cells. Cells were labeled with l-[U-14C]serine for 24 h and incubated in the presence of 40 ng/ml nocodazole for the last 4 h. The mitotic cells were collected and incubated with 2.5 IU/ml of SMase for 1 h. The lipids were extracted and separated on HPTLC plates.
Fig 4
Fig 4
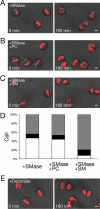
Abnormal cytokinesis is due to the SM decrease. (A) The cleavage furrows regress in the SMase-treated cells. HeLa cells stably expressing histone H2B-DsRed were incubated with 2.5 IU/ml of SMase for 1 h. The cells were washed and incubated in DMEM supplemented with 10% lipoprotein-deficient serum for an additional 3 h. (B) The regression phenotype is not suppressed by adding exogenous PC. After treatment with SMase for 1 h, the cells were washed and incubated in medium containing 20 μM egg PC (Avanti Polar Lipids, AL) for an additional 3 h at 37°C. (C) The regression phenotype is suppressed by adding exogenous SM. After treatment with SMase, the cells were washed and incubated in the medium containing 20 μM brain SM (Avanti Polar Lipids, AL) for an additional 3 h at 37°C. (D) Quantification of the phenotype. Gray, black, and white colors indicate cells with normal cytokinesis, cells without nuclear division, and cells with regressed furrows, respectively. (E) The addition of ceramide does not cause defects in cytokinesis. HeLa cells stably expressing histone H2B-DsRed (red) were incubated with 20 μM of brain ceramide (Avanti Polar Lipids, AL). Bars, 5 μm.
Fig 5
Fig 5
Cytoskeleton dynamics in the SMase-treated cells. (A) The cleavage furrow is regressed before forming the midbody in the SMase-treated cells. HeLa cells stably expressing both histone H2B-DsRed (red) and EGFP-tubulin (green) were observed in the absence (upper) or presence (lower) of SMase. (B) EGFP-MRLC is accumulated in the cleavage furrow. HeLa cells stably expressing both histone H2B-DsRed (red) and EGFP-MRLC (green) were observed in the absence (left) or presence (right) of SMase. Bars, 5 μm.
Fig 6
Fig 6
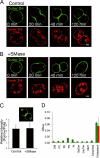
SM is not required for the accumulation of cholesterol in the cleavage furrow. (A) Cholesterol-rich domains are concentrated in the outer leaflet of the cleavage furrow. HeLa cells transiently expressing mCherry-D4 (red) were incubated with purified EGFP-D4 (green). (B) Depletion of SM does not affect the accumulation of cholesterol-rich domain. The cells described above were incubated in the presence of SMase. Bars (A and B), 5 μm. (C) Quantitative analysis of fluorescence intensity. The fluorescence intensity of EGFP-D4 was measured in the cleavage furrow (square) and the polar region (circles). The intensities were normalized to the intensity at the polar region. Data are means ± SD (n > 20). (D) EGFP-D4 and mCherry-D4 bind specifically to cholesterol. Lipid binding properties of purified protein of EGFP-D4 from E. coli (green) and cell extracts from HeLa cells expressing mCherry-D4 (red) were assayed by ELISA. Data are means ± SD (n = 3).
Fig 7
Fig 7
Depletion of SM abolishes PIP2 accumulation in the cleavage furrow. (A) Treatment with SMase does not concentrate PIP2 into the furrow. Cells expressing mCherry-PH (red) were incubated in the absence (upper) or presence (lower) of SMase, and then pictures were taken at the indicated times. Bars, 5 μm. (B) SM and PIP2 are colocalized to the cleavage furrow during cytokinesis. Cells expressing mCherry-PH (red) were stained with EGFP-lysenin (green), and then pictures were taken at the indicated times. Bar, 5 μm. (C) Fluorescence intensity of EGFP-lysenin (green) and mCherry-PH (red) was measured along the line. (D) Quantitative analysis of fluorescence intensity. The fluorescence intensity of mCherry-PH was measured in the cleavage furrow (square) and the polar region (circles). The intensities were normalized to the intensity at the polar region. Data are means ± SD (n > 20). (E) SMase treatment does not decrease the amount of PIP2. Cells were labeled with [33P]orthophosphoric acid. The mitotic cells were incubated with or without SMase for 1 h.
Fig 8
Fig 8
RhoA is less accumulated in the cleavage furrow in SMase-treated cells. (A) RhoA is not concentrated at the cleavage furrow in SMase-treated cells. Cells were incubated in the absence (left) or presence (right) of SMase for 60 min. Cells were fixed with trichloroacetic acid and stained with anti-RhoA antibody. (B) EGFP-CeRhoA weakly localizes in the cleavage furrow after SMase treatment. HeLa cells stably expressing both histone H2B-DsRed (red) and EGFP-CeRhoA (green) were observed in the absence (upper) or presence (lower) of SMase. (C) Quantitative analysis of fluorescence intensity. The fluorescence intensity of EGFP-CeRhoA was measured in the cleavage furrow (square) and the cytosol (circle). The intensities were normalized to the intensity at the cytosolic region. Data are means ± SD (n > 20). (D) MKLP1 is normally localized to the central spindle in SMase-treated cells. LLC-PK1 cells stably expressing histone H2B-DsRed (red) and EGFP-MKLP1 (green) were observed in the absence (upper) or presence (lower) of SMase. The pictures were taken at the indicated times after the SMase incubation. Bars, 5 μm.
Fig 9
Fig 9
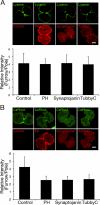
PIP2 is required for the accumulation of RhoA but not SM. (A) EGFP-lysenin is accumulated in the cleavage furrow when PIP2 is interfered with. SM was stained with EGFP-lysenin (green) in the cells overexpressing mCherry-PH (red), mCherry-synaptojanin (red), or mCherry-TubbyC (red). The intensities were normalized to the intensity at the polar region. Data are means ± SD (n > 20). (B) PIP2 is required for the accumulation of RhoA in the cleavage furrow. mCherry-PH (red), mCherry-synaptojanin (red), or mCherry-TubbyC (red) was overexpressed in HeLa cells stably expressing EGFP-CeRhoA (green). The intensities were normalized to the intensity at the cytosolic region. Data are means ± SD (n > 20). Bars, 5 μm.
Fig 10
Fig 10
Depletion of cholesterol reduces the staining of SM-rich domains. (A) Both SM- and cholesterol-rich domains are concentrated in the cleavage furrow. HeLa cells stably expressing histone H2B-DsRed (red) were incubated with EGFP-D4 (green) and mCherry-lysenin (red). (B) Depletion of cholesterol with MβCD reduces the staining of SM- and cholesterol-rich domain-specific probes. The cells were incubated in 10 mM MβCD, and the pictures were taken at the indicated times. (C) Depletion of SM with SMase does not reduce the staining of cholesterol-rich domain-specific probes. The cells were incubated with SMase, and the pictures were taken at the indicated times. Bars (A to C), 5 μM. (D) Depletion of cholesterol with MβCD reduces the total amount of cholesterol. The mitotic cells were incubated with MβCD or SMase for 1 h. The lipids were extracted, and the amount of cholesterol was measured. Data are means ± SD (n = 3).
Fig 11
Fig 11
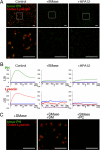
Transbilayer colocalization between the SM-rich domains in the outer leaflet and PIP2-rich domains in the inner leaflet of the plasma membrane. (A) PALM/dSTORM images of Dronpa-PH (green) and Alexa 647-labeled lysenin (red). LLC-PK1 cells expressing Dronpa-PH were stained with Alexa Fluor 647-labeled lysenin. (Center) Cells were treated with SMase for 1 h. (Right) Cells were treated with HPA12 for 48 h. (Lower) Magnified images. (B) Ripley's L-function analysis of Dronpa-PH (green)- and Alexa Fluor 647-labeled lysenin (red). Blue and magenta indicate higher and lower confidence envelopes of 99%, respectively. (C) PALM/dSTORM images of Dronpa-PH (green)- and Alexa Fluor 647-labeled lysenin (red). LLC-PK1 cells expressing Dronpa-PH were incubated with 2.5 IU/ml of SMase for 1 h at 37°C. The cells were washed and incubated for 1 h at 37°C. The cells were incubated for an additional 1 h at 37°C without exogenous lipids (left), with 50 μM brain SM (center), or with 50 μM egg PC (right). After incubation, the cells were washed and stained with Alexa Fluor 647-labeled lysenin. The lower panels show magnified images. Bars, 2 μm.
Fig 12
Fig 12
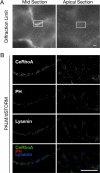
Transbilayer colocalization of SM, PIP2, and RhoA at the cleavage furrow. (A) Diffraction-limited image of Dronpa-CeRhoA. (B) PALM/dSTORM images. LLC-PK1 cells expressing Dronpa-CeRhoA and PAmCherry1-PH were stained with Alexa Fluor 647-labeled lysenin. The midsection (left) and apical section (right) were observed. Green, red, and blue indicate Dronpa-CeRhoA, PAmCherry1-PH, and Alexa Fluor 647-lysenin, respectively. Bars, 2 μm.
Fig 13
Fig 13
PIP5Kβ colocalizes with SM-rich domain. PALM/dSTORM images of Dronpa-PIP5Kβ (green) and Alexa Fluor 647-labeled lysenin (red). LLC-PK1 cells expressing Dronpa-PIP5Kβ were stained with Alexa Fluor 647-labeled lysenin. (Right) cells were treated with SMase for 1 h. The lower panels show magnified images. Bars, 2 μm.

References

    1. Ando R, Mizuno H, Miyawaki A. 2004. Regulated fast nucleocytoplasmic shuttling observed by reversible protein highlighting. Science 306: 1370–1373 - PubMed
    1. Atilla-Gokcumen GE, Bedigian AV, Sasse S, Eggert US. 2011. Inhibition of glycosphingolipid biosynthesis induces cytokinesis failure. J. Am. Chem. Soc. 133: 10010–10013 - PMC - PubMed
    1. Bligh EG, Dyer WJ. 1959. A rapid method of total lipid extraction and purification. Can. J. Biochem. Physiol. 37: 911–917 - PubMed
    1. Brown DA, London E. 1998. Functions of lipid rafts in biological membranes. Annu. Rev. Cell Dev. Biol. 14: 111–136 - PubMed
    1. Echard A. 2008. Membrane traffic and polarization of lipid domains during cytokinesis. Biochem. Soc. Trans. 36: 395–399 - PubMed

Publication types

Substances