. 2012 Apr;32(8):1566-80.
doi: 10.1128/MCB.06002-11. Epub 2012 Feb 13.

Androgen-induced activation of gonadotropin-regulated testicular RNA helicase (GRTH/Ddx25) transcription: essential role of a nonclassical androgen response element half-site

Affiliations

Androgen-induced activation of gonadotropin-regulated testicular RNA helicase (GRTH/Ddx25) transcription: essential role of a nonclassical androgen response element half-site

Joaquin Villar et al. Mol Cell Biol. 2012 Apr.

Abstract

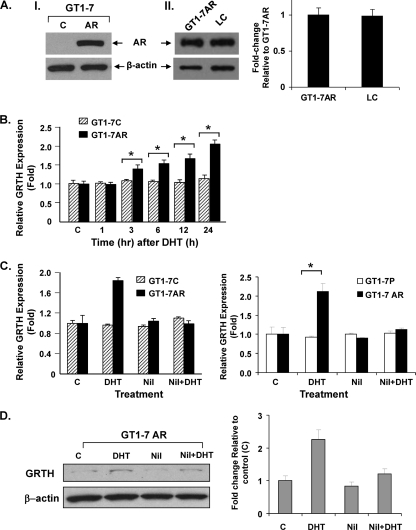
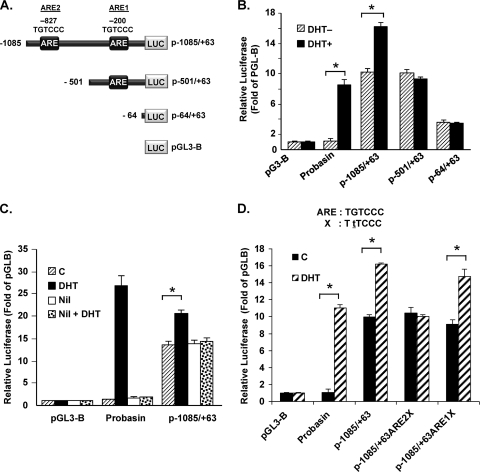
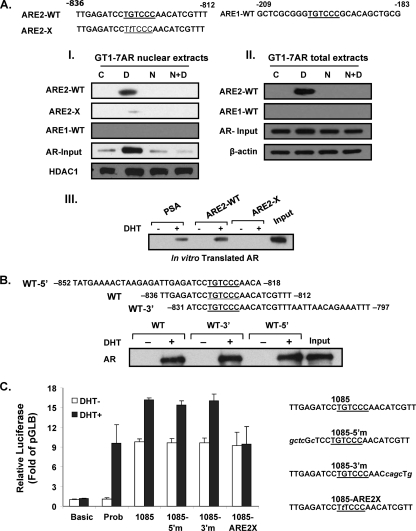
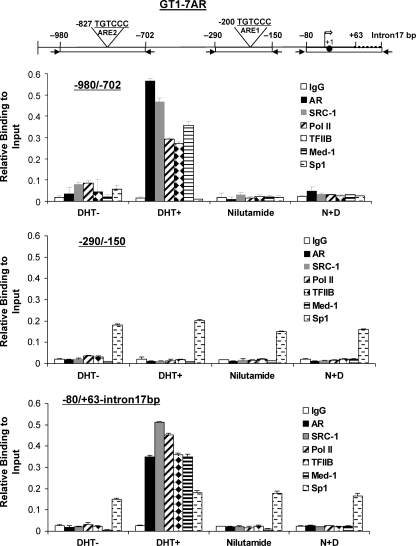
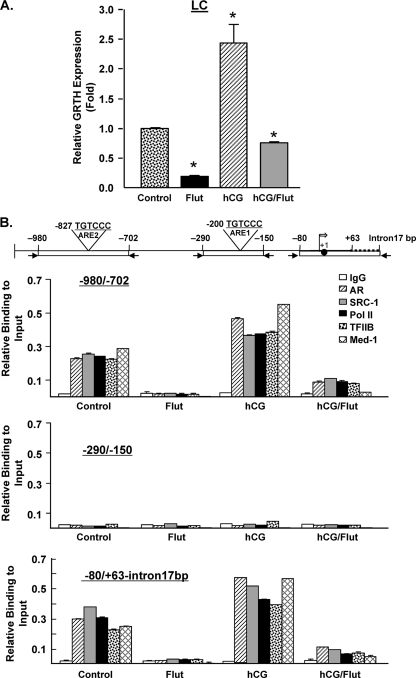
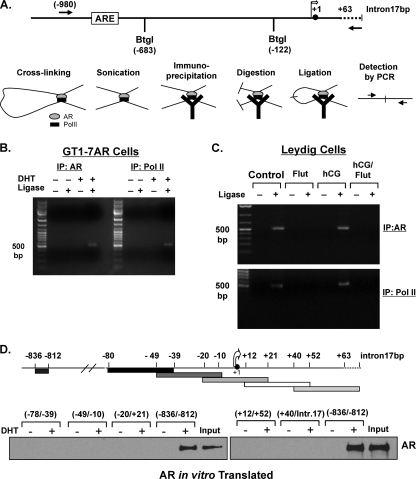
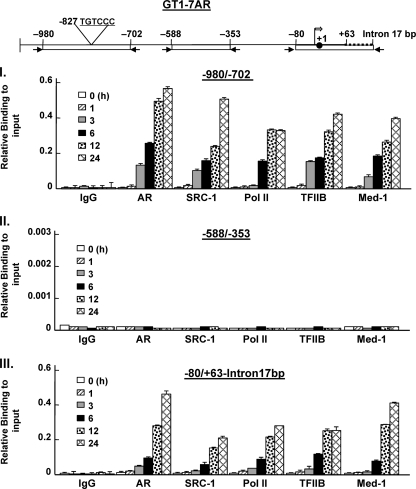
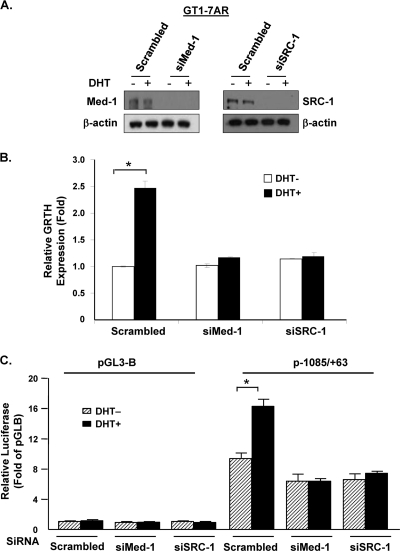
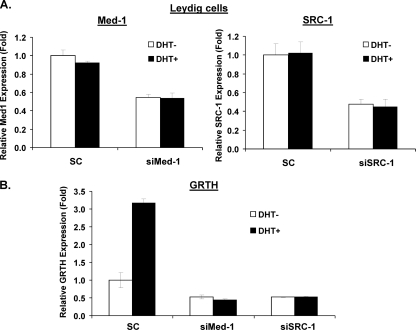
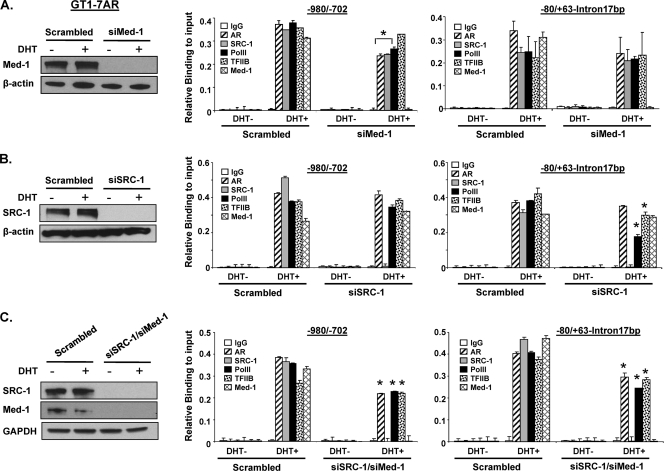
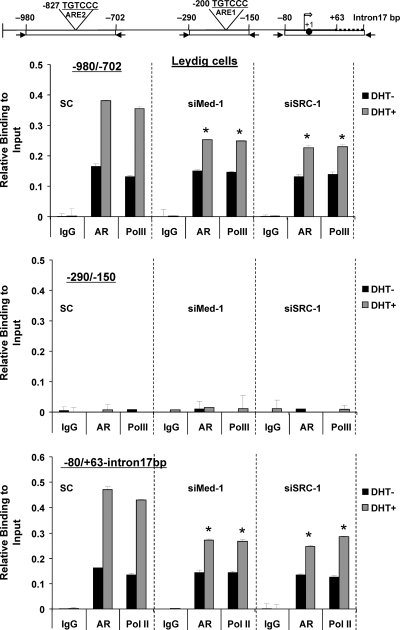
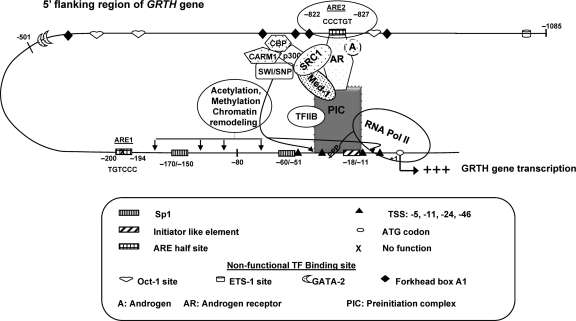
GRTH, a testis-specific member of the DEAD-box family of RNA helicases essential for spermatogenesis, is present in Leydig cells (LC) and germ cells. In LC, it exerts an autocrine negative regulation on androgen production induced by gonadotropin. GRTH is transcriptionally upregulated by gonadotropin via cyclic AMP/androgen through androgen receptors (AR). For studies of GRTH regulation by androgen in LC, we utilized in vitro/in vivo models. Androgen-induced GRTH expression was prevented by an AR antagonist. Two putative atypical ARE half-sites are present at bp -200 and -827 (ARE1 and ARE2). Point mutation of ARE2 prevented androgen-induced AR binding/function and upregulation of GRTH transcription. Chromatin immunoprecipitation (ChIP) assays showed recruitment of AR, SRC-1, Med-1, transcription factor IIB (TFIIB), and polymerase II (PolII) to GRTH ARE2 (bp -980/-702) and to the promoter region (bp -80/+63). ChIP3C assays revealed short-range chromosomal looping between AR/ARE2 and the core transcriptional machinery at the promoter. Knockdown of Med-1 and/or SRC-1 demonstrated the presence of a nonproductive complex which included AR, TFIIB, and PolII and the essential role of these coactivators in the transcriptional activation of GRTH. Our findings provide new insights into the molecular mechanism of androgen-regulated transcription in LC.


Figures

Fig 1
Fig 1
GRTH expression is transcriptionally upregulated by DHT in GT1-7 cells stably expressing AR. (A, part I) Western blot analysis of extracts from GT1-7 cells expressing AR (GT1-7AR) or control cells (lane C) with the empty vector. β-Actin expression was used as a loading control. (A, part II, left half) Western blot analysis comparing AR levels in GT1-7AR cells and mouse LC. (A, part II, right half) Signals from three independent experiments were quantified and normalized to β-actin. The AR value in LC is presented as n-fold change relative to that of GT1-7AR. The values are means ± standard errors. (B) Real-time qPCR analysis of GRTH expressed in GT1-7AR (black bars) and GT1-7 cells (GT1-7C, striped bars) following treatment with the vehicle or DHT at 10−8 M for 1 to 24 h. (C, left half) Effect of the AR antagonist nilutamide (Nil) on DHT-induced GRTH mRNA expression in GT1-7 cells stably expressing AR (GT1-7AR). GT1-7 cells transfected with the empty vector were used as a control group (GT1-7C). (C, right half) GRTH expression in parental GT1-7 (GT1-7P) and GT1-7 cells stably expressing AR (GT1-7AR). Cells were treated with nilutamide at 1 μM for 1 h prior to incubation with DHT at 10−8 M for 24 h, after which GRTH expression was assessed by RT-qPCR. Results normalized to β-actin are expressed as n-fold over the control (cells treated with the vehicle only). Each value represents the mean ± the standard error of four separate experiments, each performed in triplicate. (D) Effect of A on GRTH protein expression. (Left half) Western blot analysis of extracts from GT1-7AR cells treated with DHT in the presence or absence of nilutamide. β-Actin was used as a loading control. (Right half) Diagram of n-fold changes due to various treatments (DHT, Nil, and Nil plus DHT) relative to the values of control cells treated with the vehicle only (bar C). Signals were quantitated and normalized to β-actin. Values are means ± standard errors. *, P < 0.05.
Fig 2
Fig 2
Identification of functional ARE essential for DHT-induced GRTH promoter activity in GT1-7AR cells. (A) Schematic representation of GRTH-luciferase expression constructs p−1085/+63GL and 5′deletions. p−1085/+63GL comprises the GRTH minimal promoter region (bp −205/+63) relative to the ATG translational codon (+1) and 5′-flanking sequences with ARE half-sites located at bp −827 and −201 (boxes). (B) Serial deletion constructs indicated in panel A were transfected into GT1-7AR cells in the presence (black bars) or absence (striped bars) of DHT at 10−8 M. Luciferase activity is expressed relative to that of pGL3basic (empty vector). (C) DHT-induced promoter activity was also assessed in the presence or absence of nilutamide (Nil) treatment as described in the legend to Fig. 1. (D) Effect of a point mutation within the ARE half-site located at −827 or at −200 on DHT-induced promoter activity of p−1085/+63. WT ARE and the mutant form (X, with the mutated base underlined) are shown at the top. Luciferase activity is expressed relative to that of pGL3-B (empty vector) in all cases. The probasin construct (see Materials and Methods) was the positive control. Results are the means ± the standard errors of three individual experiments done in triplicate. *, P < 0.01.
Fig 3
Fig 3
AR recruitment to the ARE half-site at −827/−822. DAPA were performed using probes for the WT ARE sites (underlined) with sequences 5′- and 3′-flanking nucleotides (10 bp). The ARE1-WT probe (−209/−183), the ARE2-WT probe (−836/−812), or a mutant form with a point mutation (G to T) in the ARE site at −826 (ARE2-X) was incubated with nuclear extracts (panel I) or total extracts (panel II) of GT1-7AR cells treated with the vehicle, DHT [D] (10−8 M), nilutamide [N] (1 μM), DHT plus nilutamide (N+D), or in in vitro-translated AR (panel III) in the presence or absence of DHT at 10−8 M. DNA-protein complexes were precipitated with streptavidin resin and subjected to Western blot analysis. Levels of AR are shown as the input using HDAC1 as a loading control for nuclear extracts or β-actin as a loading control for total extracts. Input, 10% in vitro-translated AR. Probasin (PSA), ARE2 WT (ARE2-WT), or mutant ARE2 (ARE2-X) was used as the probe. (B) Exploration of flanking sequence requirement for association of AR upon treatment with DHT to ARE2 located at bp −827/−822 of GRTH. DAPA analysis was performed using probes GRTH-WT (−836/−812), GRTH-WT-5′ (−852/−818), and GRTH-WT-3′ (−831/−797) with in vitro-translated AR in the presence or absence of DHT at 10−8 M. Ten percent in vitro-translated AR was included as the input. (C) Effects of mutations in 5′- or 3′-flanking sequence adjacent to ARE2 at −827 and sequences flanking nonfunctional ARE1 (italic) on DHT-induced promoter activity of p−1085/+63. WT p−1085/+63GL (1085) with the WT ARE (underlined) and mutations of the adjacent 5′ (5′m) and 3′ sequences (3′m) are shown on the right. Luciferase activity is expressed relative to that of pGL3 basic in all cases. The probasin construct (Prob) was used as a positive control. Results are the means ± the standard errors of three individual experiments done in triplicate.
Fig 4
Fig 4
Recruitment of AR, SRC-1, Med-1, Sp1, TFIIB, and PolII to the GRTH gene promoter/5′-flanking region in GT1-7AR cells upon in vitro treatment with DHT. Schematic representation of the locations of the GRTH gene regions (bp −980/−702, −290/−150, and −80/+63-intron17bp) analyzed by PCR for ChIP analysis (Top). (Bottom) ChIP analysis of GT1-7AR treated with the vehicle (DHT−), DHT at 10−8 M (DHT+), (N) at 1 μM, or DHT plus nilutamide (N+D). Recruitment of AR, SRC-1, Med-1, TFIIB, Sp1, and PolII to the −980/−702, −290/−150, and −80/+63-intron17bp regions was assessed by real-time PCR and expressed as a percentage of the total input DNA. The broken line in the diagram at the top is the 17-bp intron, the solid circle is the ATG codon at position +1, and the open arrow is the transcriptional start site. Results are the means ± the standard errors of three individual experiments done in triplicate.
Fig 5
Fig 5
Recruitment of AR, SRC-1, TFIIB, and PolII to GRTH promoter/5′-flanking sequences in LC upon in vivo treatment with DHT. Mice were treated with flutamide (Flut) (0.5 mg twice a day) for 2 days prior to treatment with hCG (0.5 μg), flutamide alone, or a combination of the two. Mice treated with the vehicle were used as a control. LC were prepared as described in Materials and Methods. (A) GRTH expression was assessed by RT-qPCR and normalized to β-actin expression. Results are expressed relative to those of untreated control cells. *, P < 0.01 (B) ChIP analysis using antibodies against IgG, AR, SRC-1, Med-1, PolII, and TFIIB. Real-time PCR to assess the recruitment of proteins to these regions was performed using primers for the −980/−702, −290/−150, and −80/+63-intron17bp regions (top). The broken line in the diagram at the top is the 17-bp intron, the solid circle is the ATG codon at position +1, and the open arrow is the transcriptional start site. Results are expressed as percentages of the total input DNA. Means ± standard errors of three individual experiments done in triplicate are shown.
Fig 6
Fig 6
AR, coactivators, and PolII form a chromosomal loop between AR-bound ARE located at −827 and the GRTH transcriptional start site in GT1-7AR and mouse LC. (A) Schematic diagram showing the primers and restriction enzyme used in the 3C assay at the GRTH 5′-flanking sequence (−980/intron17bp). The diagram depicts the process of the ChIP3C/ChIP-loop assay. Y, antibody. Restriction enzyme BtgI was used for digestion. (B) 3C assays were performed with GT1-7AR cells treated with or without DHT for 24 h using AR (left) and PolII (right) antibodies. Ligation products were detected by PCR using the primers indicated in panel A. (C) 3C assay performed with LC from mice treated with control (untreated mice), flutamide (Flut), hCG, or hCG/Flut for 24 h using AR (top) or PolII antibodies (bottom). Ligation products were detected by PCR using the primers indicated in panel A. (D) DAPA analysis of the GRTH transcriptional start site region. GRTH probes (−78/−39, −49/−10, −20/+21, +12/+52, and +40/+intron17bp) were incubated with in vitro-translated AR in the presence or absence of DHT at 10−8 M precipitated with streptavidin resin, and DNA-protein complexes were analyzed by Western blot analysis. A GRTH probe (−836/−812) was included as a positive control. The broken line in the diagram at the top is the 17-bp intron, the solid circle is the ATG codon at position +1, and the open arrow is the transcriptional start site. IP, immunoprecipitate.
Fig 7
Fig 7
Time course of recruitment of AR, coactivator, and components of the transcriptional machinery to ARE and the promoter region after DHT treatment. GT1-7AR cells were treated with DHT at 10−8 M for 1 to 24 h. ChIP assays were performed as previously described using the antibodies indicated. DNA precipitated was analyzed by real-time PCR with the primers indicated at the top. The broken line in the diagram at the top is the 17-bp intron, the solid circle is the ATG codon at position +1, and the open arrow is the transcriptional start site. The results are presented as percentages of the input. Results are means ± standard errors.
Fig 8
Fig 8
AR coactivators SRC-1 and Med-1 are essential for DTH-induced GRTH transcription and expression. (A) GT1-7AR cells were transfected with siRNAs against Med-1 (siMed-1) and SRC-1 (siSRC-1) or control scrambled siRNA. Knockdown was assessed by Western blot analysis (A) using β-actin as a loading control. (B) Real-time qPCR analysis of GRTH expression in GT1-7AR cells transfected with scrambled, Med-1, or SRC-1 siRNA following treatment with the vehicle or DHT at 10−8 M for 24 h. Results (normalized to β-actin) are expressed as n-fold differences from the control (scrambled siRNA-transfected cells treated with the vehicle only). (C) The p−1085/+63 construct was transfected into GT1-7AR cells in the presence (black bars) or absence (striped bars) of DHT at 10−8 M. Luciferase activity is expressed relative to that of pGL3-B (empty vector) in all cases. Results are the means ± the standard errors of three individual experiments done in triplicate. *, P < 0.05.
Fig 9
Fig 9
SRC-1 and Med-1 are essential for DHT-induced GRTH transcription and expression in mouse LC primary culture. LC were prepared as described in Materials and Methods. Cells were cultured in the presence of siRNA against Med-1 (siMed-1) or SRC-1 (siSRC-1) or control scrambled siRNA (SC) for 24 h. Cells were incubated with inhibitors of steroid biosynthesis (see Materials and Methods) for 1 h and then treated with the vehicle or DHT at 10−8 M for 20 h. (A) Knockdown of Med-1 or SRC-1 was assessed by real-time qPCR. (B) Real-time qPCR analysis of GRTH mRNA expression in GT1-7AR cells transfected with scrambled, Med-1, or SRC-1 siRNA. Results (normalized to β-actin) are expressed as n-fold differences from the control (scrambled cells treated with the vehicle only).
Fig 10
Fig 10
Effect of knockdown of Med-1 and/or SRC-1 on AR, TFIIB, and PolII recruitment to the GRTH promoter/5′-flanking region in GT1-7AR cells. GT1-7AR cells were transfected with siRNA against Med-1 (siMed-1) (A, left side), SRC-1 (siSRC-1) (B, left side), or siSRC-1 and siMed-1 combined (C, left side). Scrambled siRNA was used as a control. Knockdown was assessed by Western blot analysis using β-actin (A and B, left side) or glyceraldehyde 3-phosphate dehydrogenase (GAPDH) (C, left side) as a loading control. ChIP assays were performed with these cells, and recruitment of AR, SRC-1, Med-1, TFIIB, and PolII to the −980/−702 and −80/+63-intron17bp regions was assessed by real-time PCR. Results are the means ± the standard errors of three individual experiments done in triplicate, *, P < 0.05.
Fig 11
Fig 11
Effect of knockdown of Med-1 and/or SRC-1 on AR, TFIIB, and PolII recruitment to the GRTH promoter/5′-flanking region in primary cultures of mouse LC. Cells cultured in the presence of siRNA against Med-1 (siMed-1) or SRC-1 (siSRC-1) or control scrambled siRNA and treated with inhibitors of steroid biosynthesis (see Materials and Methods) and DHT as described in the legend to Fig. 9. ChIP assay was performed with these cells, and recruitment of AR and PolII to the −980/−702, −290/−150, and −80/+63-intron17bp regions was assessed by real-time PCR. Results are the means ± the standard errors of three individual experiments done in triplicate. *, P < 0.05.
Fig 12
Fig 12
GATA2, FoxA1, Oct-1, or ETS-1 does not participate in DHT-induced GRTH expression. GT1-7AR cells were transfected with siRNA against GATA2 (siGATA2), FoxA1 (siFoxA1), Oct-1 (siOct-1), or ETS-1 (siETS-1). Scrambled siRNA was used as a control. (A) Knockdown was assessed by Western blot analysis using β-actin as the loading control. (B) The p−1085/+63 construct was transfected into GT1-7AR cells in the presence or absence of DHT at 10−8 M. Luciferase activity is expressed relative to that of pGL3-B (empty vector) in all cases. Results are the means ± the standard errors of three individual experiments done in triplicate. *, P < 0.05.
Fig 13
Fig 13
Model of A action on GRTH gene transcription in mouse LC. In vivo and in vitro, A activates the AR (A/AR). The A/AR binds to the functional ARE2 site at −827/−822 and interacts with a member(s) of the PIC and PolII through short-range chromosomal looping. SRC-1 and Med-1, which associates with the AR, are required for functional activation of transcription of the loop complex of the GRTH gene induced by A. Oct-1, ETS, GATA2, and Forkhead box A1 are nonfunctional putative TF binding sites.

Similar articles

Cited by

References

    1. Belakavadi M, Fondell JD. 2006. Role of the mediator complex in nuclear hormone receptor signaling. Rev. Physiol. Biochem. Pharmacol. 156: 23–43 - PubMed
    1. Bennett NC, Gardiner RA, Hooper JD, Johnson DW, Gobe GC. 2010. Molecular cell biology of androgen receptor signalling. Int. J. Biochem. Cell Biol. 42: 813–827 - PubMed
    1. Briegel K, et al. 1993. Ectopic expression of a conditional GATA-2/estrogen receptor chimera arrests erythroid differentiation in a hormone-dependent manner. Genes Dev. 7: 1097–1109 - PubMed
    1. Collins LL, et al. 2003. The androgen receptor in spermatogenesis. Cytogenet. Genome Res. 103: 299–301 - PubMed
    1. Dekker J, Rippe K, Dekker M, Kleckner N. 2002. Capturing chromosome conformation. Science 295: 1306–1311 - PubMed