. 2012 Aug;56(2):544-54.
doi: 10.1002/hep.25655. Epub 2012 Jul 6.

Laser captured hepatocytes show association of butyrylcholinesterase gene loss and fibrosis progression in hepatitis C-infected drug users

Affiliations

Laser captured hepatocytes show association of butyrylcholinesterase gene loss and fibrosis progression in hepatitis C-infected drug users

Supriya Munshaw et al. Hepatology. 2012 Aug.

Abstract

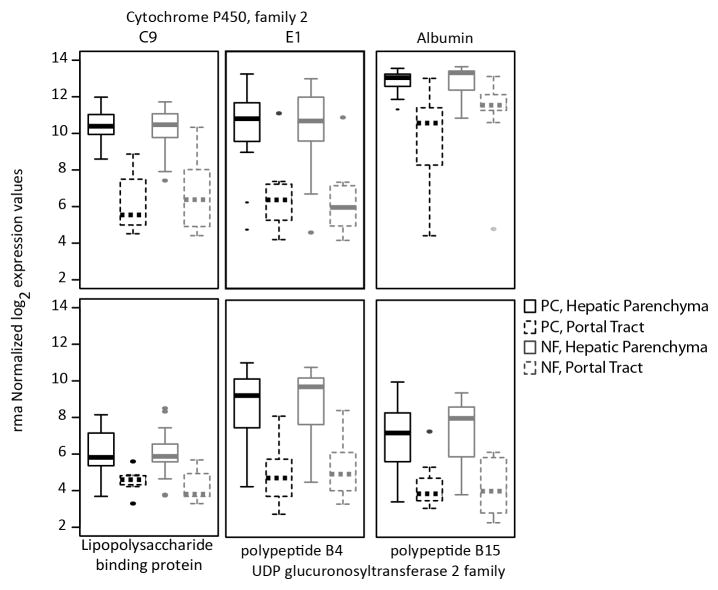
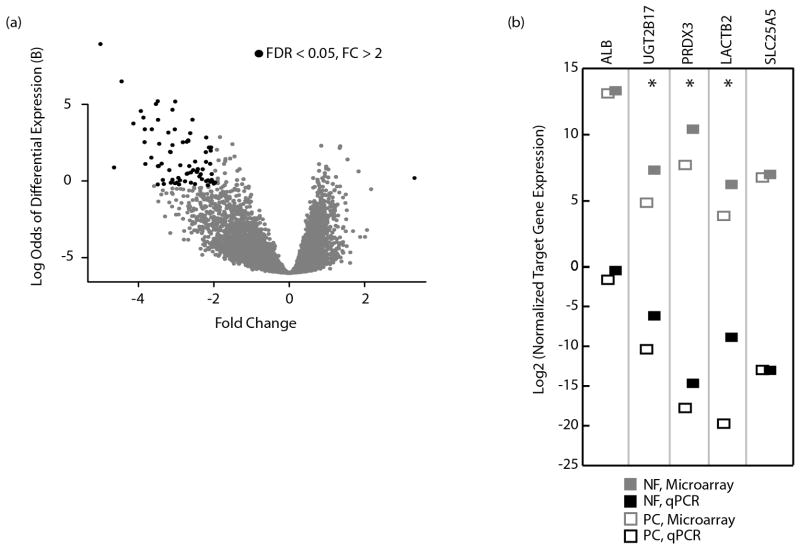
Chronic hepatitis C virus (HCV) infection is complicated by hepatic fibrosis. Hypothesizing that early fibrogenic signals may originate in cells susceptible to HCV infection, hepatocyte gene expression was analyzed from persons with chronic HCV at different stages of liver fibrosis. Four HCV-infected subjects with precirrhosis liver fibrosis (Ishak fibrosis 3-5) were matched for age, race, and gender to five HCV-infected subjects with no evidence of fibrosis (Ishak fibrosis 0). Hepatocytes from each subject were isolated from liver biopsies using laser capture microdissection. Transcriptome profiling was performed on hepatocyte RNA using hybridization arrays. We found that hepatocytes in precirrhosis fibrosis were depleted for genes involved in small molecule and drug metabolism, especially butyrylcholinesterase (BCHE), a gene involved in the metabolism of drugs of abuse. Differential expression of BCHE was validated in the same tissues and cross-sectionally in an expanded cohort of 143 HCV-infected individuals. In a longitudinal study, serum BCHE activity was already decreased at study inception in 19 fibrosis progressors compared with 20 fibrosis nonprogressors (P < 0.05). Nonprogressors also had decreased BCHE activity over time compared with initial values, but these evolved a median (range) 8.6 (7.8-11.4) years after the study period inception (P < 0.05). Laser captured portal tracts were enriched for immune related genes when compared with hepatocytes but precirrhosis livers lost this enrichment.

Conclusion: Chronic HCV is associated with hepatocyte BCHE loss years before hepatic synthetic function is impaired. These results indicate that BCHE may be involved in the pathogenesis of HCV-related fibrosis among injection drug users.


Figures

Figure 1
Figure 1
Microanatomic Hepatic Regions Separately Isolated using LCM. (a) Portal tracts (left panel) were identified by the presence of portal veins (PV), bile ducts (BD), and hepatic arteries (HA). After separation, pictures were obtained to confirm isolation and exclusion of hepatocytes (right panel). LM, 20X, hematoxylin. (b) Hepatic parenchyma was identified and categorized by its proximity to portal tracts as denoted by the dashed white line. In this figure, the periportal zone corresponding to the parenchyma surrounding the portal tract is shown pre- (left panel) and post- (right panel) capture. LM, 10X, hematoxylin.
Figure 2
Figure 2. Laser captured hepatic parenchyma is enriched for hepatocyte-specific genes
LCM was used to isolate separate hepatic regions that are based on microanatomic distinctions. Hepatic parenchyma (solid lines) was separated from portal tracts (dashed lines) in pre-cirrhotic (PC; black lines) and no fibrosis (NF; gray lines) livers, and RNA was extracted and hybridized to expression arrays. Six genes on the array were identified a priori that were anticipated to be specific for hepatocytes. Absolute expression of each gene confirmed enrichment of hepatocytes in the hepatic parenchyma, and exclusion from portal tracts. All comparisons between portal tracts and hepatic parenchyma have adjusted p values <0.01. In each case, the box itself contains the middle 50% of the data. The upper edge of the box indicates the 75th percentile of the data set, and the lower edge indicates the 25th percentile. The line in the box indicates the median value of the data.
Figure 3
Figure 3. Hepatocytes from PC and NF livers reveal asymmetric transcriptomes
(a) Shown is a volcano plot of differentially expressed genes between hepatocytes from PC and NF liver tissue, defined by log2 absolute expression of genes in the PC group minus the absolute expression of genes in the NF group. Genes in black have an FDR < 0.05 and show > 2 fold differences in expression (b) Validation of the microarray is shown for selected genes. Median normalized expression levels for the respective microarray values (gray) and qPCR amounts (black) are given for a parenchymal specimen from each subject. The qPCR data was normalized to 7SL while the microarray data was normalized using rma. *p<0.05.
Figure 4
Figure 4. Validation of differential BCHE expression in tissue and serum
(a) Normalized log2 expression levels of BCHE by qPCR in representative hepatocytes (left) and by hybridization array in all hepatocytes (right) is shown in NF (solid squares) and PC (open squares) liver tissue. Downregulation of BCHE is shown in hepatocytes in PC compared to NF liver tissue (p<0.05 for both methods, Mann-Whitney-Wilcoxon test). (b, c, d & e) Subjects in the ALIVE cohort were selected for having staged liver disease by liver biopsy or transient elastography and available contemporaneous serum samples. SBA was tested (b) and compared to contemporaneous serum albumin (c), APRI (d) and, bilirubin (e) levels. Median values are shown with first and third quantiles in different groups of Ishak fibrosis stage. Adjusted p values shown were calculated using a pairwise Mann-Whitney-Wilcoxon test with a BH correction in R.
Figure 5
Figure 5. BCHE protein expression is decreased before the onset of hepatic fibrosis
(a) Median SBA and (b) serum ALB levels during 4 visits spanning an average of 11.75 years for progressors (gray) and non-progressors (black). Median values are depicted with first and third quantiles. The asterisks depict p < 0.05 in a Mann-Whitney-Wilcoxon test between progressors and non-progressors at each time point. The horizontal brackets depict p < 0.05 by paired Wilcoxin Signed Rank Test between time points within the progressor group and non-progressor group with significant differences in SBA and serum ALB levels.
Figure 6
Figure 6. Gene Ontology (GO) enrichment for biological processes differs between portal tracts in PC and NF liver tissue
The number of genes upregulated genes in each group is shown. GO categories were assigned using DAVID and an adjusted p < 0.05 (Bonferroni correction) threshold for detection enrichment. The entire set of 11170 genes after removal of absent genes was used as the background for enrichment analysis.

References

    1. World Health Organization. Hepatitis C: global prevalence. Weekly Epidemiological Record. 1997;72:341–348. - PubMed
    1. Armstrong GL, Wasley A, Simard EP, McQuillan GM, Kuhnert WL, Alter MJ. The prevalence of hepatitis C virus infection in the United States, 1999 through 2002. Ann Intern Med. 2006 May 16;144(10):705–714. - PubMed
    1. Thomas DL, Seeff LB. Natural history of hepatitis C. Clin Liver Dis. 2005 Aug;9(3):383–98. vi. - PubMed
    1. Friedman SL. Molecular regulation of hepatic fibrosis, an integrated cellular response to tissue injury. J Biol Chem. 2000 Jan 28;275(4):2247–2250. - PubMed
    1. Lin W, Tsai WL, Shao RX, Wu G, Peng LF, Barlow LL, et al. Hepatitis C virus regulates transforming growth factor beta1 production through the generation of reactive oxygen species in a nuclear factor kappaB-dependent manner. Gastroenterology. 2010 Jun;138(7):2509–18. 2518. - PMC - PubMed

Publication types

MeSH terms

Substances

Supplementary concepts