. 2012 Feb 28;109(9):3389-94.
doi: 10.1073/pnas.1109407109. Epub 2012 Feb 13.

Size control of the Drosophila hematopoietic niche by bone morphogenetic protein signaling reveals parallels with mammals

Affiliations

Size control of the Drosophila hematopoietic niche by bone morphogenetic protein signaling reveals parallels with mammals

Delphine Pennetier et al. Proc Natl Acad Sci U S A. .

Abstract

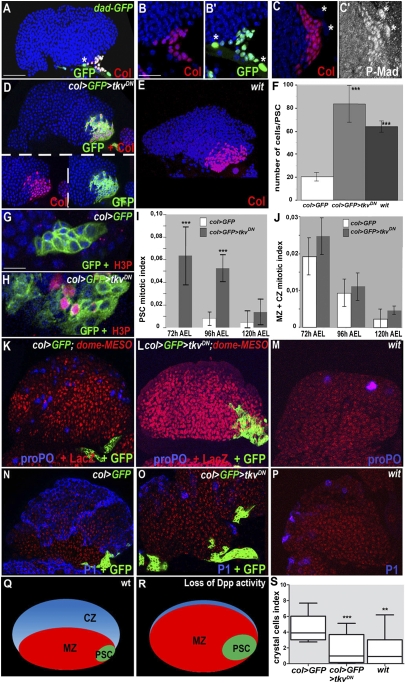
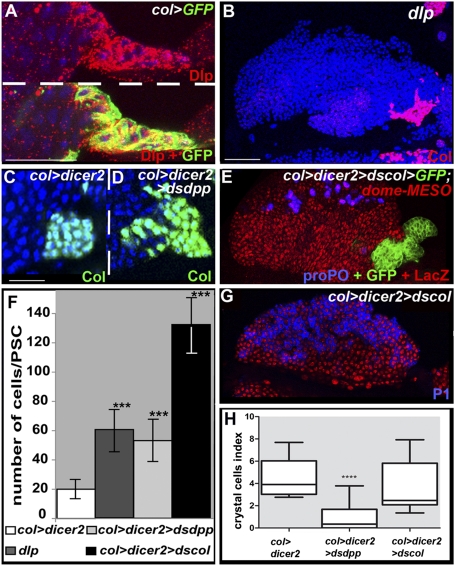
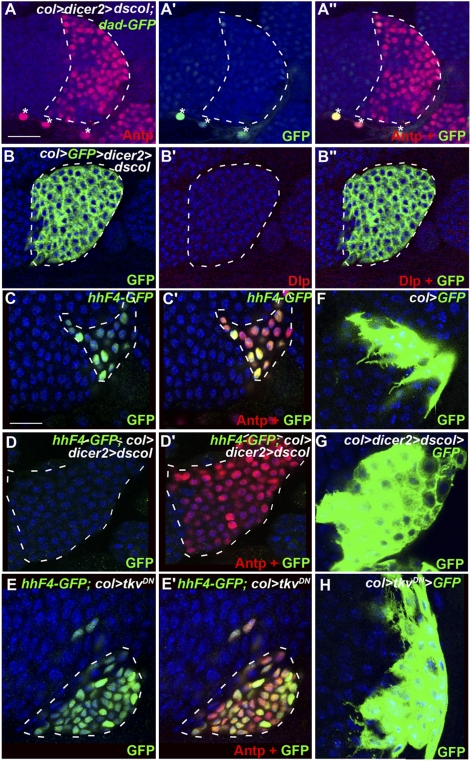
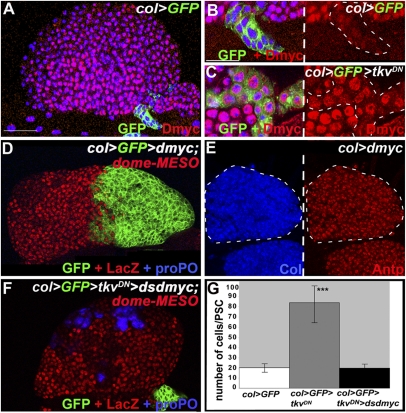
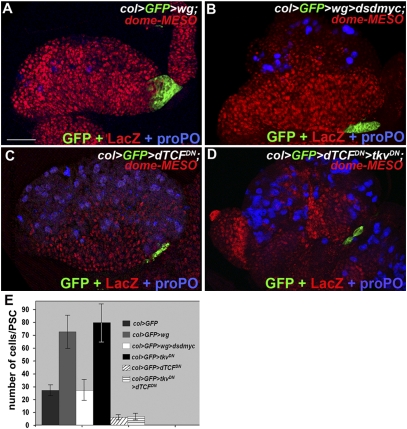
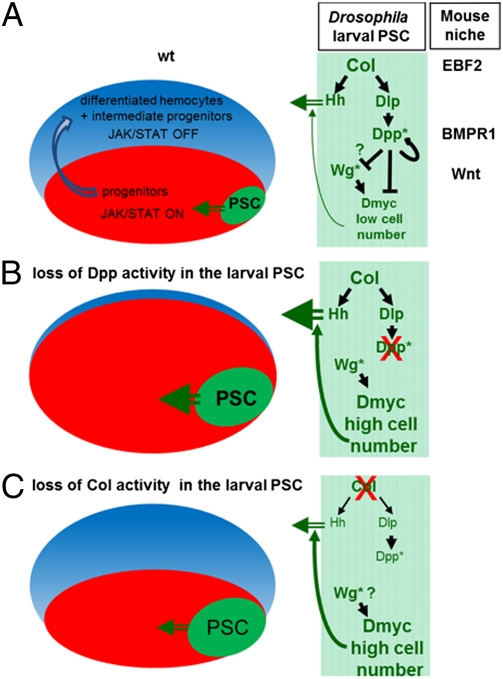
The Drosophila melanogaster larval hematopoietic organ, the lymph gland, is a model to study in vivo the function of the hematopoietic niche. A small cluster of cells in the lymph gland, the posterior signaling center (PSC), maintains the balance between hematopoietic progenitors (prohemocytes) and their differentiation into specialized blood cells (hemocytes). Here, we show that Decapentaplegic/bone morphogenetic protein (Dpp/BMP) signaling activity in PSC cells controls niche size. In the absence of BMP signaling, the number of PSC cells increases. Correlatively, no hemocytes differentiate. Controlling PSC size is, thus, essential for normal blood cell homeostasis. Activation of BMP signaling in the PSC requires expression of the Dally-like heparan-sulfate proteoglycan, under the control of the Collier/early B-cell factor (EBF) transcription factor. A Dpp > dpp autoregulatory loop maintains BMP signaling, which limits PSC cell proliferation by repressing the protooncogene dmyc. Dpp antagonizes activity of wingless (Wg)/Wnt signaling, which positively regulates the number of PSC cells via the control of Dmyc expression. Together, our data show that Collier controls hemocyte homeostasis via coordinate regulation of PSC cell number and PSC signaling to prohemocytes. In mouse, EBF2, BMP, and Wnt signaling in osteoblasts is required for the proper number of niche and hematopoietic stem cells. Our findings bring insights to niche size control and draw parallels between Drosophila and mammalian hematopoiesis.


Conflict of interest statement

The authors declare no conflict of interest.

Figures

Fig. 1.
Fig. 1.
The BMP signaling pathway is specifically activated in PSC cells and is required to limit their numbers. (A) dad-GFP expression (green) in the LG is restricted to PSC cells, marked by Col (red). (BC′) Enlarged views showing colocalization of Col with dad-GFP (B and B′) and high P-Mad levels (C and C′); *pericardial cells. (AE) Col staining (red) shows that the PSC of col > GFP> tkvDN (D) and wit mutant larvae (E) contains roughly fourfold more cells than wt (A and F). (G and H) H3P staining (red) in the PSC (green) in the presence or absence of BMP signaling. (I and J) Measured mitotic indices of the PSC (I) and MZ + CZ (J), in wt and col > GFP > tkvDN LGs, 72, 96, and 120 h AEL. Error bars represent SDs. ***P < 0.001 in F and I (Student t test). (KP) col > GFP (K and N) and col > GFP > tkvDN (L and O) LGs expressing dome-MESO in prohemocytes (red) and wit mutant LGs (M and P) stained for crystal cells (proPO; blue) (KM) or plasmatocytes (P1; blue) (NP). (Q) Schematic diagram of a wt LG lobe, with the PSC in green, MZ in red, and CZ containing intermediate progenitors and differentiated hemocytes in blue. (R) Loss of Dpp activity results in a bigger PSC and reduced levels of hemocyte differentiation. (S) Crystal cell index (***P < 0.0009; **P < 0.0053; *P < 0.0147). Nuclei are labeled by Topro (blue) (AE, G, and H) and (red) (MP). [Scale bars: 80 μm (A, D, E, KP); 40 μm (G and H); 20 μm (BC′).]
Fig. 2.
Fig. 2.
BMP signaling in the PSC requires expression of Dally like under the control of Col and an autoregulatory loop. (A) Immunostaining of col > GFP LGs for Dlp (red), showing high level expression in PSC cells (green). (B) dlp mutant LGs display a larger PSC (Col immunostaining, pink). (C and D) Reducing dpp expression in the PSC leads to an increased number of PSC cells (D). (E and G) Decreasing col level in the PSC leads to an oversized PSC without affecting the balance between prohemocytes (dome-MESO expression, red) and either crystal cells (proPO, blue) (E) or plasmatocytes (P1, blue) (G). (F) Number of PSC cells (***P < 0.001; Student t test). (H) Crystal cell index (****P < 0,0001; Student t test). (Topro blue, BD; red, G.) [Scale bars: 80 μm (B, E, and G); 40 μm (A, C, and D).]
Fig. 3.
Fig. 3.
Col expression in PSC cells is required for maintaining their signaling properties. (AA′′) Double staining of col > dscol LGs for Antp (red) and dad-GFP (green). The PSC does not activate Dpp signaling upon removal of Col; *cardial cells. (BB′′) Dlp expression (red) is also lost. (CE′) Antp (red) and hh-GFP staining (green) labeling of PSC cells in wt (C and C′), col > dicer2 > dscol (D and D′), and col > tkvDN (E and E′) LGs. (F) PSC-targeted expression of mCD8-GFP (col > mCD8-GFP) shows numerous filopodia extended by wt PSC cells. (G and H) Filopodia are lost in the absence of Col activity (G), whereas they are preserved in the absence of Dpp activity (H). (Topro (blue), AH.) [Scale bars: 40 μm (AB′′); 20 μm (CH).]
Fig. 4.
Fig. 4.
PSC repression of the protooncogene dmyc by Dpp signaling. (A and B) Dmyc immunostaining (red) in wt LG. (B) Enlargement view showing that col > GFP PSC cells (green) express a very low level of Dmyc. (C) Inactivation of Dpp signaling (col > tkvDN) in the PSC leads to increased Dmyc expression. (D and E) Overexpression of dmyc results in a very large PSC, visualized by either col > GFP (green) (D) or Col (blue) or Antp (red) (E). (D) dome-MESO expression (red) shows an expanded MZ, whereas no crystal cells (proPO, blue) differentiate. (F and G) PSC cell number is close to wt and hemocyte differentiation is restored (proPO staining, blue) when dmyc dsRNA and TkvDN are coexpressed in the PSC (green). ***P < 0.001 in G (Student t test). (Topro (blue) in AC.) [Scale bars: 80 μm (A, DF); 20 μm (BC′).
Fig. 5.
Fig. 5.
Wingless signaling controls PSC cell number. (A) Increasing wg expression in the PSC (col > GFP > wg) leads to an increased number of PSC cells (green), expansion of the MZ (dome-MESO, red), and reduced crystal cell differentiation (proPO, blue). (B) PSC cell number and crystal cell differentiation return to wt when dmyc dsRNA is coexpressed with wg. (C and D) Blocking either Wg signaling (col > dTCFDN) (C) or Wg plus Dpp signaling (col> dTCFDN > tkvDN) (D) in the PSC results in a PSC containing six cells on average. (Scale bar: 80 μm AD.) (E) Quantification of PSC cell numbers.
Fig. 6.
Fig. 6.
Role of BMP and Wg signaling in the Drosophila PSC: parallels with the mouse HSC niche. (AC) Schematic representation of Drosophila LGs (Left) and the interactions among Col, Dpp, and Wg signaling in the PSC (niche, green) (Right). (A) In wt LGs, signals issued from the PSC maintain Jak-Stat signaling in hemocyte progenitors (red) and control the balance between prohemocyte maintenance and hemocyte differentiation (intermediate progenitors and differentiated hemocytes, blue). Col activity in the PSC both controls the expression of Hh, one prohemocyte maintenance signal (7) and the niche size by restricting BMP signaling to PSC cells, via activation of Dlp. A paracrine/autocrine Dpp > dpp autoregulatory loop maintains a high level of BMP signaling and represses Dmyc in the PSC. Conversely, Wg signaling positively regulates Dmyc expression. Wg is epistatic to Dpp signaling in the PSC, but whether Dpp signaling only represses the Wg pathway or also acts in parallel to Wg in controlling dmyc expression remains an open question. *Represents the signaling pathway. The role of Dpp signaling in the PSC and roles of EBF2, BMPR1A, and Wnt in mouse osteoblasts (10, 44) highlight parallels between the Drosophila and mammalian hematopoietic niches. (B) Blocking Dpp activity in PSC cells leads to increased levels of Dmyc expression and increased number of cells. Because each PSC cell expresses normal levels of prohemocyte maintenance signals, the MZ receives more signal and more progenitors are maintained at the expense of differentiation. (C) Reducing Col expression in the larval PSC results in both down-regulation of Dlp expression and Dpp signaling and Hh expression, leading to an increase in the number of PSC cells, with each cell producing less Hh signal. The overall effect is restoring normal homeostasis in the LG.

References

    1. Krzemien J, Crozatier M, Vincent A. Ontogeny of the Drosophila larval hematopoietic organ, hemocyte homeostasis and the dedicated cellular immune response to parasitism. Int J Dev Biol. 2010;54:1117–1125. - PubMed
    1. Lanot R, Zachary D, Holder F, Meister M. Postembryonic hematopoiesis in Drosophila. Dev Biol. 2001;230:243–257. - PubMed
    1. Jung SH, Evans CJ, Uemura C, Banerjee U. The Drosophila lymph gland as a developmental model of hematopoiesis. Development. 2005;132:2521–2533. - PubMed
    1. Lebestky T, Jung SH, Banerjee U. A Serrate-expressing signaling center controls Drosophila hematopoiesis. Genes Dev. 2003;17:348–353. - PMC - PubMed
    1. Krzemien J, Oyallon J, Crozatier M, Vincent A. Hematopoietic progenitors and hemocyte lineages in the Drosophila lymph gland. Dev Biol. 2010;346:310–319. - PubMed

Publication types

MeSH terms

LinkOut - more resources