. 2012 Feb 28;109(9):3522-7.
doi: 10.1073/pnas.1109818109. Epub 2012 Feb 13.

Unified quantitative model of AMPA receptor trafficking at synapses

Affiliations

Unified quantitative model of AMPA receptor trafficking at synapses

Katalin Czöndör et al. Proc Natl Acad Sci U S A. .

Abstract

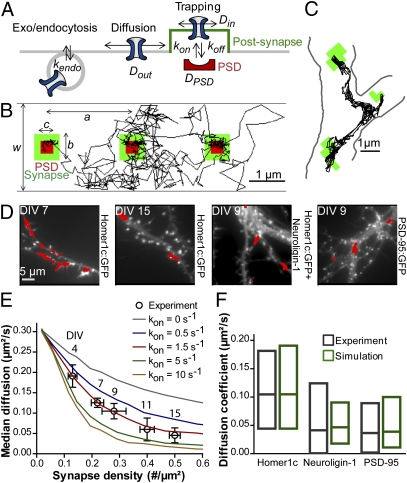
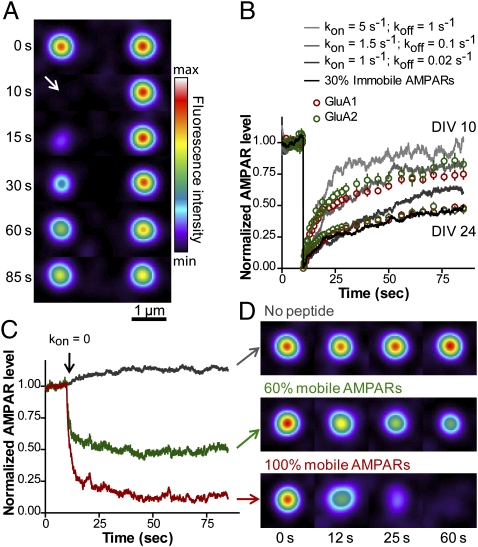
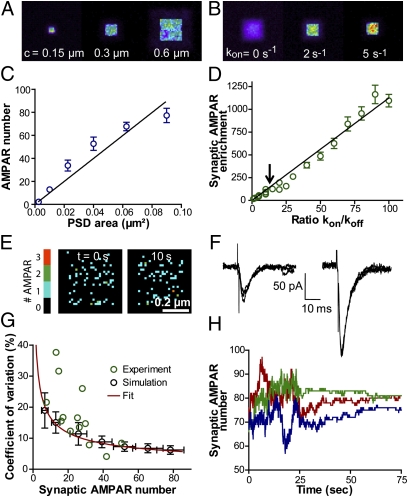
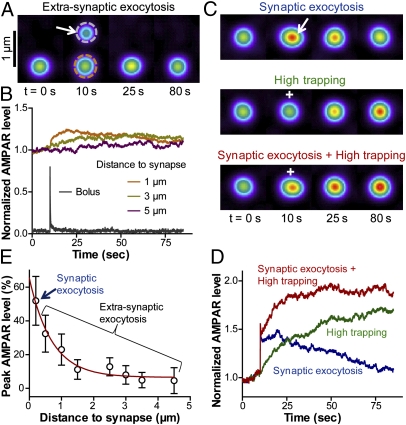
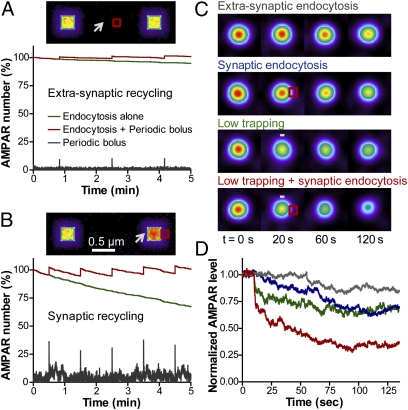
Trafficking of AMPA receptors (AMPARs) plays a key role in synaptic transmission. However, a general framework integrating the two major mechanisms regulating AMPAR delivery at postsynapses (i.e., surface diffusion and internal recycling) is lacking. To this aim, we built a model based on numerical trajectories of individual AMPARs, including free diffusion in the extrasynaptic space, confinement in the synapse, and trapping at the postsynaptic density (PSD) through reversible interactions with scaffold proteins. The AMPAR/scaffold kinetic rates were adjusted by comparing computer simulations to single-particle tracking and fluorescence recovery after photobleaching experiments in primary neurons, in different conditions of synapse density and maturation. The model predicts that the steady-state AMPAR number at synapses is bidirectionally controlled by AMPAR/scaffold binding affinity and PSD size. To reveal the impact of recycling processes in basal conditions and upon synaptic potentiation or depression, spatially and temporally defined exocytic and endocytic events were introduced. The model predicts that local recycling of AMPARs close to the PSD, coupled to short-range surface diffusion, provides rapid control of AMPAR number at synapses. In contrast, because of long-range diffusion limitations, extrasynaptic recycling is intrinsically slower and less synapse-specific. Thus, by discriminating the relative contributions of AMPAR diffusion, trapping, and recycling events on spatial and temporal bases, this model provides unique insights on the dynamic regulation of synaptic strength.


Conflict of interest statement

The authors declare no conflict of interest.

Figures

Fig. 1.
Fig. 1.
Model definition and comparison with SPT experiments. (A) Schematic diagram of the model. Kinetic parameters include Dout (extrasynaptic diffusion), Din (synaptic diffusion), DPSD (diffusion coefficient of the PSD), kon (AMPAR/scaffold binding rate), koff (AMPAR/scaffold dissociation rate), and kendo (endocytosis rate). (B) Simulated trajectory (50 s). The synapse is in green, the PSD in red, and dendrite borders in gray. Geometric parameters are: a (synapse spacing), b (synapse width), c (PSD width), w (dendrite width). (C) High-magnification 30-s trajectory of an AMPAR-bound Qdot on the surface of a DIV 9 neuron, Homer1c:GFP puncta being outlined in green. (D) AMPAR trajectories (red traces) are shown for DIV 7 and DIV 15 neurons expressing Homer1c:GFP (white), and for DIV 9 neurons coexpressing Homer1c:GFP (white) and neuroligin-1, or expressing PSD-95:GFP (white). (E) Experimental (○) and simulated (plain curves) AMPAR median diffusion coefficients obtained at different neuronal ages (DIV 4–15) or varying synaptic spacing (0.75–30 μm), respectively, were plotted against synapse density. The simulated curves were computed for different kon values, keeping koff = 0.1 s−1. (F) Interquartile distributions of AMPAR diffusion coefficients from experiments (black) and simulations (green). Neuroligin-1 expression, which doubled the number of Homer1c-positive puncta, was mimicked by a decrease in synapse spacing (a = 1 μm). Overexpressing PSD-95 was modeled by enhancing kon (2.5 s−1) to mimic an increase in PSD binding sites, plus an increase in PSD size (c = 0.4 μm).
Fig. 2.
Fig. 2.
Comparison of the model with FRAP and peptide competition experiments. (A) Time-lapse images of simulated FRAP experiments. AMPARs were treated as light point sources represented by Gaussian intensity profiles. The synapse on the left was photobleached at t = 10 s (arrow), and fluorescence recovery was monitored for 75 s. AMPAR levels at control synapses (Right) slightly decrease due to redistribution of bleached AMPARs. (B) Simulated recovery curves generated using several (kon, koff) pairs (gray scale) plotted against experimental FRAP data obtained for DIV 10 and DIV 24 neurons expressing pHluorin-tagged GluA1 or GluA2 (red and green circles, respectively). The black curve represents 70% mobile AMPARs (kon = 1.5 s−1 and koff =0.1 s−1) plus 30% immobile AMPARs (kon = 1.5 s−1 and koff = 0 s−1). (C and D) To mimic disruption of AMPAR/scaffold interactions by intracellular peptides, kon was set to zero at t = 10 s, resulting in rapid AMPAR loss from the synapse. All AMPARs were considered either mobile (koff = 0.1 s−1; red) or 60% mobile and 40% immobile (koff = 0 s−1; green). AMPAR levels at control synapses (gray) slightly increase because AMPARs displaced by peptide competition redistribute among neighboring synapses.
Fig. 3.
Fig. 3.
Mean and fluctuations of AMPAR number at synapses. (A and B) Heat maps of AMPAR distribution in the plasma membrane, calculated for different PSD sizes and kon values, respectively. The intensity corresponds to the number of times each pixel was visited by an AMPAR during a 100-s period. (C) AMPAR number per synapse as a function of PSD area (mean ± SEM, 10 PSDs). For larger PSDs, there is an inflection in the curve because of limited numbers of available AMPARs to populate synapses in the simulations. (D) Ratio between AMPAR density at the PSD vs. extrasynaptic space as a function of kon/koff (mean ± SEM, 10 PSDs). The arrow points to the AMPAR enrichment corresponding to kon = 1.5 s−1 and koff = 0.1 s−1. (E) Fluctuations of AMPAR number at a single PSD over time. The number of AMPARs per pixel is color coded. (F) AMPAR-mediated EPSCs upon ionotophoretic application of glutamate at synapses. Several recordings are superimposed. Note a larger scatter for the synapse showing the smaller average AMPAR current. (G) The mean and variance in AMPAR number at synapses were calculated for different AMPAR densities in the simulations (25–125 AMPAR/μm2). CV plotted vs. the mean synaptic AMPAR number (black circles). The red curve represents a fit with the equation √P(1 − P)/n, expected from a binomial distribution, where n is the average synaptic AMPAR number and P is the probability for an AMPAR to be in a synapse (P = 0.65, taken as the ratio between synaptic and total AMPAR numbers). Green circles represent electrophysiology data. (H) Reduction in the fluctuations of AMPAR number at PSDs upon mimicking cross-linking by lowering koff (0.02 s−1) and Dout (0.0002 μm2/s) simultaneously (at t = 25 s). Three representative curves are shown.
Fig. 4.
Fig. 4.
Effect of exocytosis and trapping on AMPAR accumulation at the PSD. (A) Time-lapse images of extrasynaptic exocytosis, where a bolus of 50 AMPARs was delivered 1 μm from a synapse (arrow). (B) The distance between the locus of exocytosis and synapses was varied between 1 and 5 μm, and AMPAR level was measured in synapses (color) or at the exocytosis location (gray), both normalized by the basal synaptic AMPAR level. (C) Time-lapse images of simulated experiments, where the AMPAR bolus was delivered in the synapse 0.2 μm from the PSD (arrow), kon was doubled (plus sign), or both modifications were applied simultaneously. (D) Normalized synaptic AMPAR level over time, for the three conditions indicated in C. (E) Initial increase in synaptic AMPAR level as a function of the distance between the exocytic zone and the PSD (mean ± SD, 16 simulations). The red curve is an exponential decay fitting the data.
Fig. 5.
Fig. 5.
Effect of endocytosis and trapping on AMPAR distribution at the PSD. (A and B) AMPAR endocytosis at EZs (red squares) was counterbalanced by periodic exocytic events (arrows). Images show the AMPAR distribution for extrasynaptic (A) or synaptic recycling (B). Note AMPAR enrichment at the PSD in the latter case. The graphs show the overall decrease of AMPAR surface density by endocytosis alone (green), and the steady-state AMPAR level (red) restored by periodic exocytosis (gray peaks). (C) Images illustrating changes in AMPAR level in four different conditions, imposed at t = 10 s: kendo was increased 10-fold above baseline either at extrasynaptic (gray) or synaptic (blue) EZs; kon was decreased twofold (minus sign, green); or both kendo was increased and kon decreased simultaneously (red). (D) Synaptic AMPAR level vs. time for the four conditions illustrated in C.

References

    1. Derkach VA, Oh MC, Guire ES, Soderling TR. Regulatory mechanisms of AMPA receptors in synaptic plasticity. Nat Rev Neurosci. 2007;8:101–113. - PubMed
    1. Newpher TM, Ehlers MD. Glutamate receptor dynamics in dendritic microdomains. Neuron. 2008;58:472–497. - PMC - PubMed
    1. Lledo PM, Zhang X, Südhof TC, Malenka RC, Nicoll RA. Postsynaptic membrane fusion and long-term potentiation. Science. 1998;279:399–403. - PubMed
    1. Yudowski GA, et al. Real-time imaging of discrete exocytic events mediating surface delivery of AMPA receptors. J Neurosci. 2007;27:11112–11121. - PMC - PubMed
    1. Makino H, Malinow R. AMPA receptor incorporation into synapses during LTP: The role of lateral movement and exocytosis. Neuron. 2009;64:381–390. - PMC - PubMed

Publication types

MeSH terms

Substances

LinkOut - more resources