

Global climate evolution during the last deglaciation
- PMID: 22331892
- PMCID: PMC3358890
- DOI: 10.1073/pnas.1116619109
Global climate evolution during the last deglaciation
Abstract
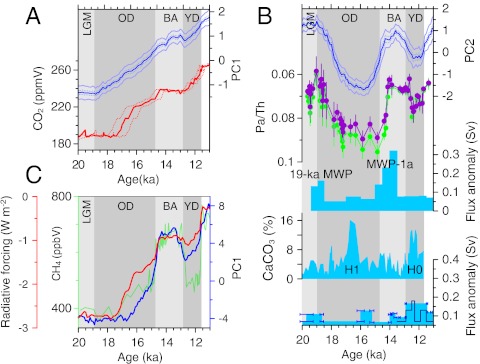
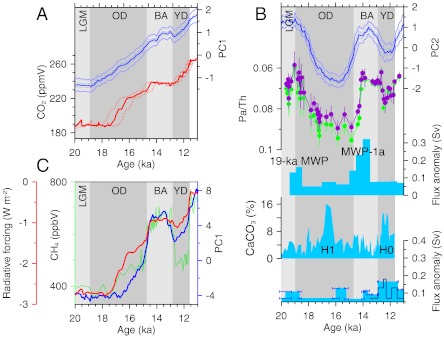
Deciphering the evolution of global climate from the end of the Last Glacial Maximum approximately 19 ka to the early Holocene 11 ka presents an outstanding opportunity for understanding the transient response of Earth's climate system to external and internal forcings. During this interval of global warming, the decay of ice sheets caused global mean sea level to rise by approximately 80 m; terrestrial and marine ecosystems experienced large disturbances and range shifts; perturbations to the carbon cycle resulted in a net release of the greenhouse gases CO(2) and CH(4) to the atmosphere; and changes in atmosphere and ocean circulation affected the global distribution and fluxes of water and heat. Here we summarize a major effort by the paleoclimate research community to characterize these changes through the development of well-dated, high-resolution records of the deep and intermediate ocean as well as surface climate. Our synthesis indicates that the superposition of two modes explains much of the variability in regional and global climate during the last deglaciation, with a strong association between the first mode and variations in greenhouse gases, and between the second mode and variations in the Atlantic meridional overturning circulation.
Conflict of interest statement
The authors declare no conflict of interest.
Figures
 ) is 64%. (B) PC2 based on all of the SST records (solid blue line). PC2s based only on alkenone (dashed light-blue line) and Mg/Ca records (dashed orange line) are also shown. The percentage of variance explained by PC2 is 29%, by PC2 (Mg/Ca) is 13%, and by PC2 (
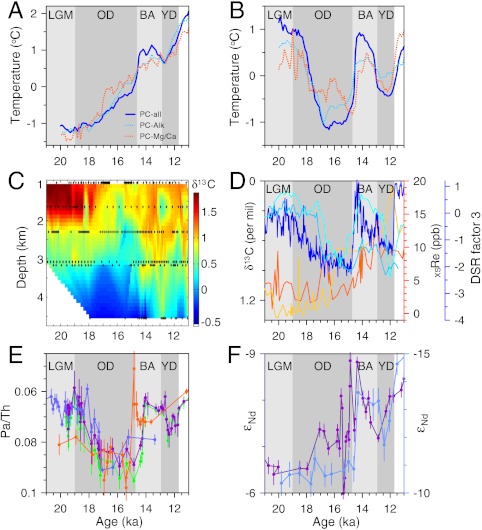
 ) is 15%. (C) Temporal evolution of δ13C in the North Atlantic basin reconstructed from data shown by black diamonds based on a depth transect of six marine cores (, , , –171). (D) Proxy records of intermediate-depth waters from the Arabian Sea and Pacific Ocean. Cyan line is δ13C record from the Arabian Sea (20), sky blue line is five-point running average of δ13C record from the SW Pacific Ocean (19), blue line is diffuse spectral reflectance (factor 3 loading) (a proxy of organic carbon) from the North Pacific (24), yellow and orange lines are records of excess Re (a proxy of dissolved oxygen) from the southeast Pacific (21). (E) Pa/Th records from the North Atlantic Ocean (27, 28, 172). (F) ϵNd records from the North Atlantic (14) (blue line) and south Atlantic (173) (purple line). Abbreviations are as in Fig. 2.
References
-
- Monnin E, et al. Atmospheric CO2 concentrations over the last glacial termination. Science. 2001;291:112–114. - PubMed
-
- Lemieux-Dudon B, et al. Consistent dating for Antarctic and Greenland ice cores. Quat Sci Rev. 2010;29:8–20.
-
- Brook EJ, Harder S, Severinghaus J, Steig EJ, Sucher CM. On the origin and timing of rapid changes in atmospheric methane during the last glacial period. Global Biogeochem Cycles. 2000;14:559–571.
-
- Schilt A, et al. Glacial-interglacial and millennial-scale variations in the atmospheric nitrous oxide concentration during the last 800,000 years. Quat Sci Rev. 2010;29:182–192.
-
- Broecker WS. Thermohaline circulation, the Achilles heel of our climate system: Will man-made CO2 upset the current balance. Science. 1997;278:1582–1588. - PubMed
Publication types
MeSH terms
Substances
LinkOut - more resources
Full Text Sources
Molecular Biology Databases
