. 2012 Feb 28;109(9):3540-5.
doi: 10.1073/pnas.1119201109. Epub 2012 Feb 13.

N-acetyl serotonin derivatives as potent neuroprotectants for retinas

Affiliations

N-acetyl serotonin derivatives as potent neuroprotectants for retinas

Jianying Shen et al. Proc Natl Acad Sci U S A. .

Abstract

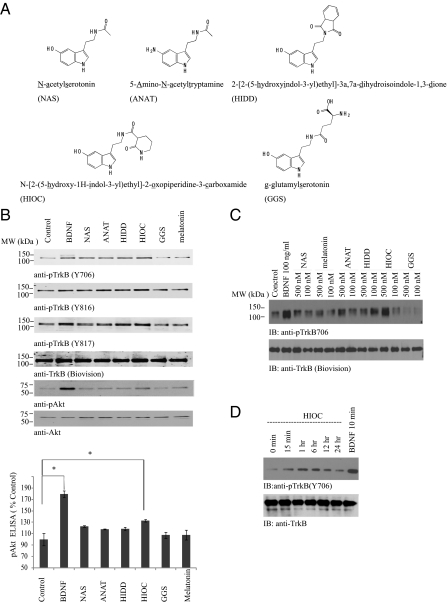
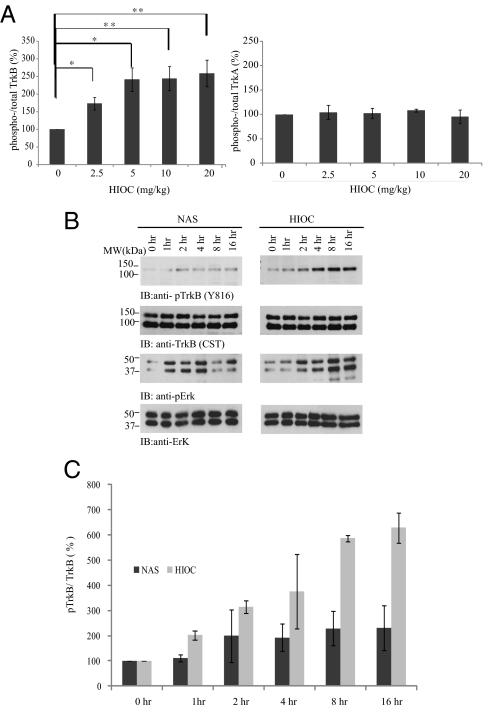
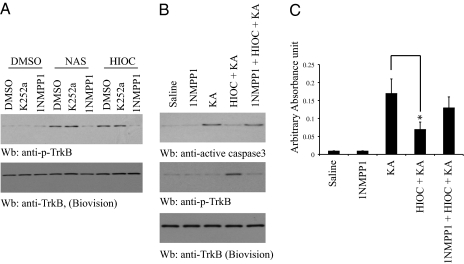
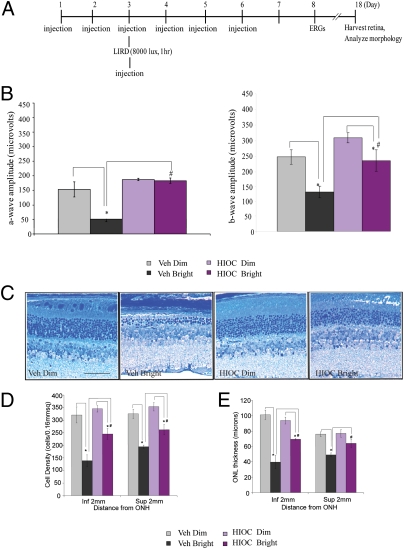
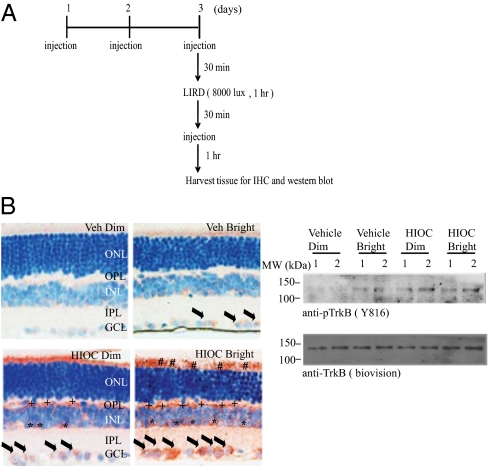
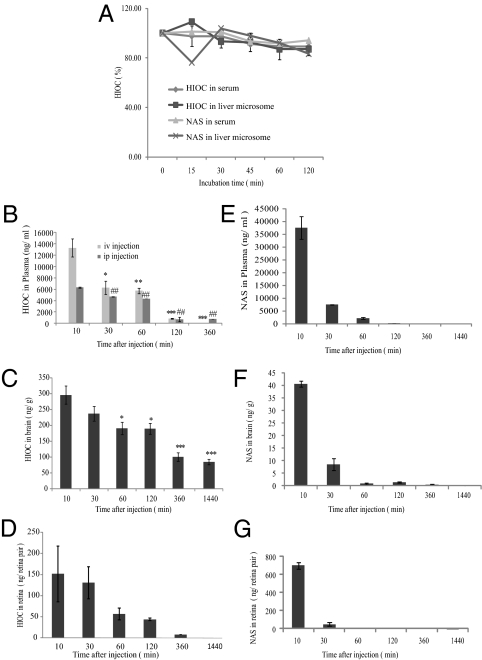
N-acetylserotonin (NAS) is synthesized from serotonin by arylalkylamine N-acetyltransferase (AANAT), which is predominantly expressed in the pineal gland and retina. NAS activates TrkB in a circadian manner and exhibits antidepressant effects in a TrkB-dependent manner. It also enhances neurogenesis in hippocampus in sleep-deprived mice. Here we report the identification of NAS derivatives that possess much more robust neurotrophic effects with improved pharmacokinetic profiles. The compound N-[2-(5-hydroxy-1H-indol-3-yl)ethyl]-2-oxopiperidine-3-carboxamide (HIOC) selectively activates TrkB receptor with greater potency than NAS. It potently protects retinas from light-induced retinal degeneration (LIRD), which is tightly coupled with pronounced TrkB activation in retinas. Pharmacokinetic studies demonstrate that this compound is stable in serum and liver microsomes. It can pass the blood-brain barrier and blood-retinal barrier. Hence, HIOC is a good lead compound for further drug development for treating retinal degenerative diseases.


Conflict of interest statement

The authors declare no conflict of interest.

Figures

Fig. 1.
Fig. 1.
HIOC reveals the most potent TrkB activation activity in primarily cultured cortical neurons. (A) Chemical structures of NAS and its four derivatives (ANAT, HIDD, HIOC, and GGS). (B) TrkB activation and downstream signaling in primary cortical neurons treated with various compounds. Primary rat cortical neurons from E18 embryos (12 DIV) were treated with 500 nM of the NAS derivatives for 30 min. As positive controls, neurons were treated with 100 ng /mL BDNF for 10 min. The neuron cell lysates were collected and resolved by 10% SDS/PAGE. Immunoblotting was conducted with various antibodies (Upper). The neuronal lysates were also subjected to p-Akt ELISA analysis (Lower). (C) The dosage titration assay. The primary cultures were treated with 100 and 500 nM of various compounds for 30 min. The cell lysates from the neurons were analyzed by immunoblotting with p-TrkB antibody. HIOC activated TrkB much stronger at 500 nM than at 100 nM. (D) Time course assay of TrkB activation in primary cortical neurons treated with HIOC. Primary rat cortical neurons from E18 embryos (12 DIV) were treated with 500 nM compound for indicated time. As positive controls, neurons were treated with 100 ng/mL BDNF for 10 min. The neuron cell lysates were collected and resolved by 10% SDS/PAGE. Immunoblotting was conducted with various antibodies.
Fig. 2.
Fig. 2.
HIOC activates TrkB receptor in animals. (A) HIOC activates TrkB in a dose-dependent manner in vivo. C57BL/6J mice were killed at 2 h after i.p. injection with indicated dose of HIOC and hippocampal lysates were analyzed by immunoblotting with anti-pTrkB (Y816), anti-pTrkA (Y785), anti-TrkB, and anti-TrkA antibodies. The ratios of p-TrkB/total TrkB and p-TrkA/total TrkA were calculated according to the specific bands using Image J software. HIOC activated TrkB in a dose-dependent manner, whereas it did not activate TrkA receptor (n = 4)(mean ± SEM, *P < 0.05, **P < 0.01, One-way ANOVA). (B and C) HIOC reveals long lasting TrkB activation activity than NAS in vivo. C57BL/6J mice were i.p. injected with 20 mg/kg of NAS or HIOC for indicated time, and hippocampal and cortical lysates were analyzed by immunoblotting with various antibodies. The ratios of p-TrkB/total TrkB were calculated according to the density of specific bands using Image J software. The data were from two sets of replicated experiments (n = 3; mean ± SEM).
Fig. 3.
Fig. 3.
HIOC exerts its neuroprotective actions via TrkB receptor. (A) HIOC activates TrkB F616A mutant. Cortical neurons from TrkB F616A knockin mice were prepared and pretreated with 1NMPP1 (100 nM) for 2 h, followed by stimulation with NAS and its derivative HIOC. Cell lysates were analyzed by immunoblotting with anti-p-TrkB. (B) HIOC suppresses kainic acid (KA)-induced neuronal cell death in TrkB F616A mutant mice, which can be blocked by 1NMPP1. TrkB F616A mice were pretreated with 1NMPP1 (50 μM in drinking water) or water 1 d before the experiment. HIOC (20 mg/kg, i.p.) was injected into TrkB F616A mice 1 h before KA (20 mg/kg). Brain lysates were prepared 4 h after KA treatment and analyzed by immunoblotting with anti-active caspase 3 and anti-p-TrkB. (C) Caspase-3 ELISA. The above brain lysate samples were subjected to quantitative active caspase-3 ELISA analysis. The data were from three sets of replicated experiments (mean ± SEM). (*P < 0.05, Student t test).
Fig. 4.
Fig. 4.
HIOC mitigates retinal damage induced by bright light. (A) Schematic experimental schedule. BALB/c mice (n = 4–5 per group) were administered i.p. injections of 40 mg/kg of HIOC once daily, for 6 consecutive days. On day 3, they were exposed to bright light (1 h at 8,000 lux) in a cylindrical light damage apparatus. HIOC was injected 30 min before and after light exposure. Electroretinogram (ERG) recordings were conducted on day 8 and retinas were harvested on day 18 to determine the extent of cellular and tissue damage. (B) ERG recordings. ERG a-wave amplitudes (Left) were measured at a flash intensity of 6.28 cd-s /m2. Light-induced retinal damage (LIRD) results in significant degradation of ERG a-wave amplitude in vehicle-treated animals (*P < 0.05), but not in HIOC treated animals. Furthermore, vehicle-treated animals have degraded ERG a-wave amplitudes compared with HIOC treated animals subjected to LIRD (#P < 0.05). ERG b-wave (Right) amplitudes were measured at a flash intensity of 6.28 cd-s/m2. LIRD results in significant degradation of ERG b-wave amplitude in both vehicle-treated animals and in HIOC-treated animals (*P < 0.05). Furthermore, vehicle-treated animals have degraded ERG b-wave amplitudes compared with HIOC treated animals subjected to LIRD (#P < 0.05). (C) Toluidine blue stain of retinas. Eyes were harvested, fixed in 2.5% glutaraldehyde/sodium cacodylate buffer, and processed for toluidine blue staining. Vertical sections (10 μm) of the retina were obtained through the optic nerve head (ONH) for eyes from all experimental groups of mice. (D) The cell density of outer nuclear layer (ONL) cells was measured at a distance of 2 mm superior and inferior from the ONH. LIRD results in significant photoreceptor cell loss in inferior and posterior retina, in both vehicle-treated animals and in HIOC treated animals (*P < 0.05). Further, vehicle-treated animals have more photoreceptor cell loss compared with HIOC treated animals subjected to LIRD (#P < 0.05). (E) The thickness of the ONL was measured at a distance of 2mm superior and inferior from the ONH. LIRD results in reduced ONL thickness in the inferior retina in both vehicle-treated animals and in HIOC treated animals (*P < 0.05). LIRD results in reduced ONL thickness in the posterior retina only in vehicle-treated animals (*P < 0.05), but not in HIOC-treated animals. Further, vehicle-treated animals have much thinner ONLs in inferior and superior retina compared with HIOC treated animals subjected to LIRD (# P < 0.05).
Fig. 5.
Fig. 5.
HIOC activates TrkB receptor in the retinas. (A) Schematic experimental design. BALB/c mice were administered i.p. injections of 40 mg/kg of HIOC once daily, for 3 consecutive days. On day 3, they were exposed to bright light (1 h at 8,000 lux) in a cylindrical light damage apparatus. HIOC was injected 30 min before and after light exposure. One hour after the second administration of HIOC, mice were killed. Retinas from two mice per group were harvested for Western blotting. Two mice per group for immunohistochemistry staining were perfused with 4% PFA, and tissues were harvested for paraffin sections. (B) HIOC activates TrkB receptor in the retinas. Immunohistochemistry staining was conducted (Left). Phospho-TrkB was detected in ganglion cells (black arrows), possibly amacrine cells, and Müller glial cells (asterisks), in the outer plexiform layer (+ signs; possibly Müller glial and microgial processes), and in outer segments (# signs). Phospho-TrkB was demonstrable to some extent in HIOC-treated animals exposed to dim light (HIOC, Dim) and in some ganglion cells in vehicle-treated animals exposed to bright light (Vehicle, Bright). The nucleus was stained with hematoxylin. ONL, outer nuclear layer; OPL, outer plexiform layer; INL, inner nuclear layer; IPL, inner plexiform layer; GCL, ganglion cell layer. TrkB in retinas was potently activated by HIOC using Western blot assay. Fifty micrograms of retinal lysates were subjected to 10% SDS/PAGE and immunoblotted with anti-pTrkB (Y816) and anti-TrkB.
Fig. 6.
Fig. 6.
Pharmacokinetic profiles of HIOC. (A) HIOC and NAS stability assay in mouse serum and liver microsomes in vitro. HIOC and NAS were incubated in mouse serum or liver microsomes for 15, 30, 45, 60 and 120 min at 37 ºC. Data present mean of 2–3 samples per time point ± SEM of two duplicated samples. (BD) Pharmacokinetics of HIOC in the plasma (B) (n = 3; Results were expressed as mean ± SEM, *, **, or ##, P <0.01; *** or ##, P < 0.001, compared the groups detected at 10 min; one-way ANOVA), the brain (C) (n = 3; Results were expressed as mean ± SEM, *, ** and ***P < 0.01, One-way ANOVA) and the retinas (D) after i.p. injection. Adult BALB/c mice (n = 3 per time point) were i.p. injected with 40 mg/kg of HIOC. Blood, retinas and brains were collected at 10, 30, 60, 120, 360, and 1,440 min after single injection. (EG) Pharmacokinetics of NAS in the plasma (E), the brain (F), and the retinas (G) after i.p. injection. Adult BALB/c mice (n = 3 per time point) were i.p. injected with 90 mg/kg of NAS. Blood, retinas, and brains were collected at 10, 30, 60, 120, 360, and 1,440 min after a single injection. Data for BG represent mean of three animals per time point ± SEM.

References

    1. Chattoraj A, Liu T, Zhang LS, Huang Z, Borjigin J. Melatonin formation in mammals: In vivo perspectives. Rev Endocr Metab Disord. 2009;10:237–243. - PMC - PubMed
    1. Jang SW, et al. N-acetylserotonin activates TrkB receptor in a circadian rhythm. Proc Natl Acad Sci USA. 2010;107:3876–3881. - PMC - PubMed
    1. Sompol P, et al. N-acetylserotonin promotes hippocampal neuroprogenitor cell proliferation in sleep-deprived mice. Proc Natl Acad Sci USA. 2011;108:8844–8849. - PMC - PubMed
    1. Satake N, Morton BE. Scotophobin A causes dark avoidance in goldfish by elevating pineal N-acetylserotonin. Pharmacol Biochem Behav. 1979;10:449–456. - PubMed
    1. Morton DJ. Both hydroxy- and methoxyindoles modify basal temperature in the rat. J Pineal Res. 1987;4:1–5. - PubMed

Publication types

MeSH terms

LinkOut - more resources