. 2012 Apr 1;28(7):929-37.
doi: 10.1093/bioinformatics/bts065. Epub 2012 Feb 13.

Positional correlation analysis improves reconstruction of full-length transcripts and alternative isoforms from noisy array signals or short reads

Affiliations

Positional correlation analysis improves reconstruction of full-length transcripts and alternative isoforms from noisy array signals or short reads

Shuji Kawaguchi et al. Bioinformatics. .

Abstract

Motivation: A reconstruction of full-length transcripts observed by next-generation sequencer or tiling arrays is an essential technique to know all phenomena of transcriptomes. Several techniques of the reconstruction have been developed. However, problems of high-level noises and biases still remain and interrupt the reconstruction. A method is required that is robust against noise and bias and correctly reconstructs transcripts regardless of equipment used.

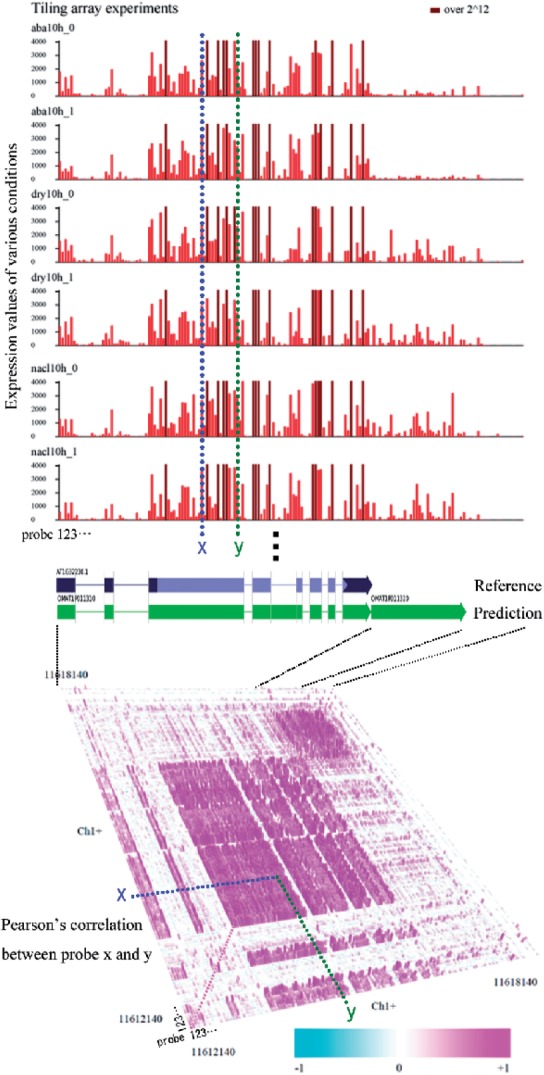
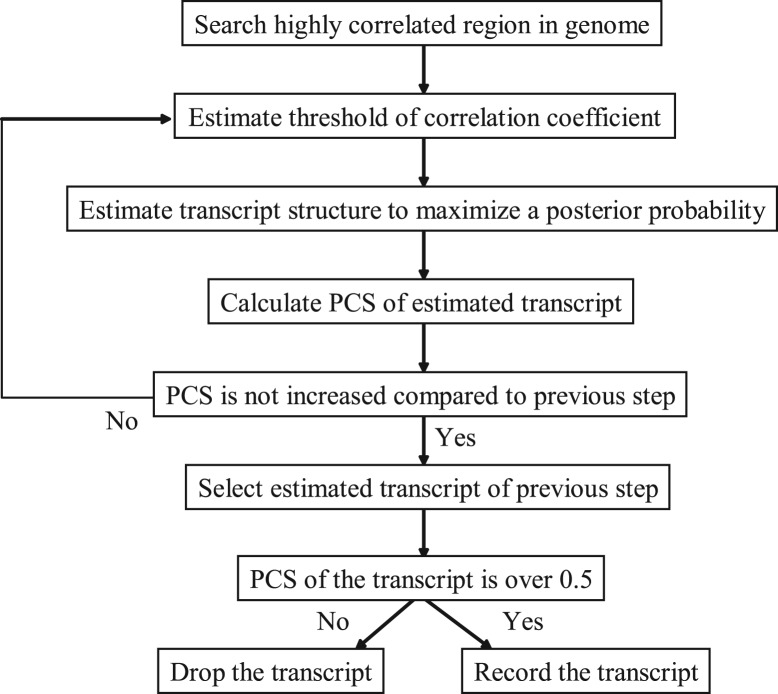
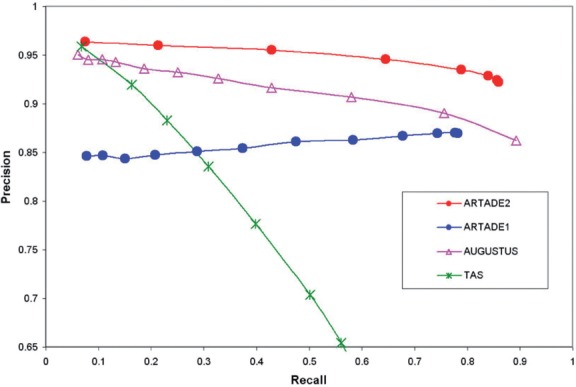
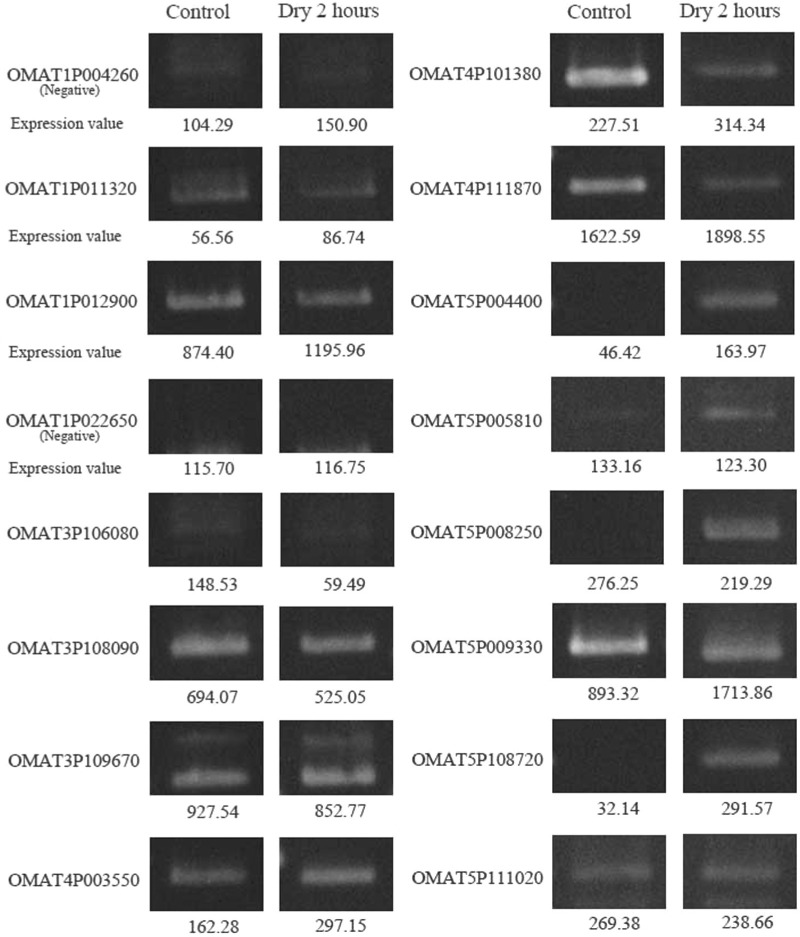
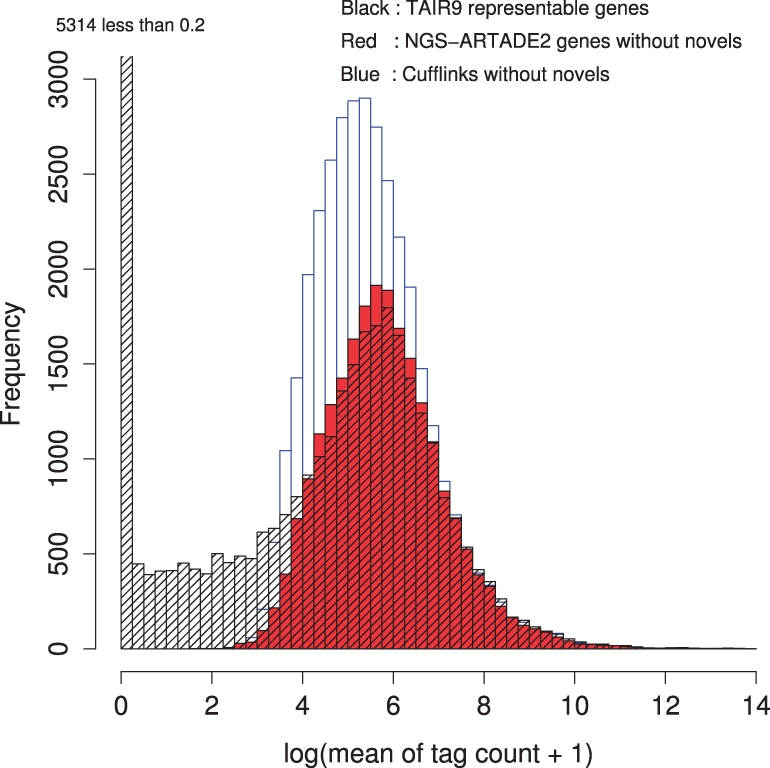
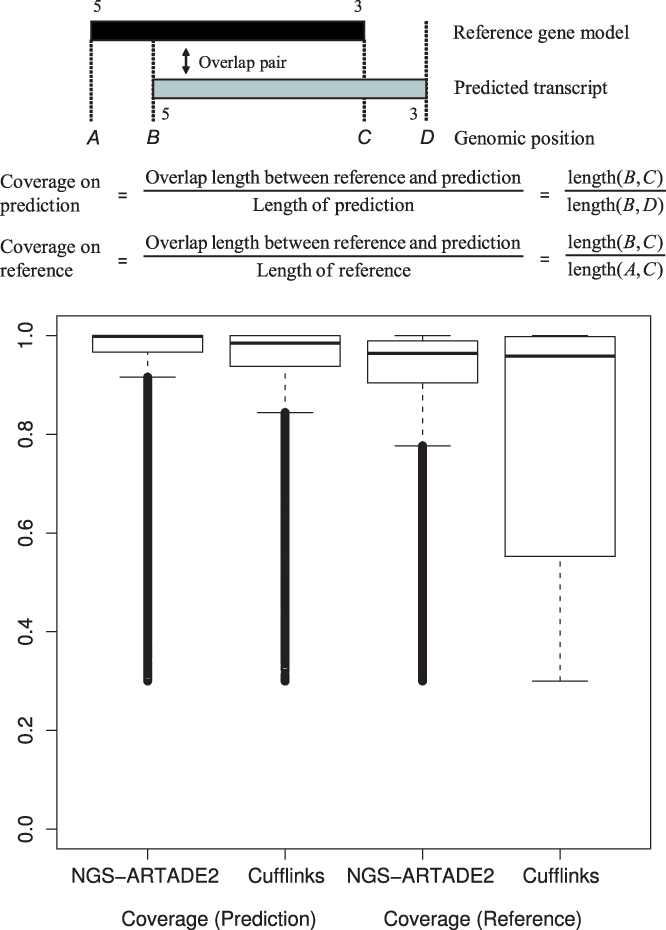
Results: We propose a completely new statistical method that reconstructs full-length transcripts and can be applied on both next-generation sequencers and tiling arrays. The method called ARTADE2 analyzes 'positional correlation', meaning correlations of expression values for every combination on genomic positions of multiple transcriptional data. ARTADE2 then reconstructs full-length transcripts using a logistic model based on the positional correlation and the Markov model. ARTADE2 elucidated 17 591 full-length transcripts from 55 transcriptome datasets and showed notable performance compared with other recent prediction methods. Moreover, 1489 novel transcripts were discovered. We experimentally tested 16 novel transcripts, among which 14 were confirmed by reverse transcription-polymerase chain reaction and sequence mapping. The method also showed notable performance for reconstructing of mRNA observed by a next-generation sequencer. Moreover, the positional correlation and factor analysis embedded in ARTADE2 successfully detected regions at which alternative isoforms may exist, and thus are expected to be applied for discovering transcript biomarkers for a wide range of disciplines including preemptive medicine.

Availability: http://matome.base.riken.jp

Contact: toyoda@base.riken.jp

Supplementary information: Supplementary data are available at Bioinformatics online.


Figures

Fig. 1.
Fig. 1.
Positional correlation of transcriptomes mapped on a 2D omic-space plane (Toyoda and Wada, 2004). Positional correlations are calculated from every possible combination of 18 conditional (55 experiments) tiling arrays. Prediction of exon structure using only one measurement is difficult because each fragment is influenced by bias and noise. Exon structure is clearly shown, however, by using positional correlations of tiling array probes. As a result, ARTADE2 could predict two transcripts in the region including a novel transcript (chromosome 1 Plus 11616183..11617412). The novel transcript was also evaluated by reverse transcription–polymerase chain reaction (RT–PCR) and cDNA sequencing. (find OMAT1P011320 on Fig. 6 and Supplementary Table S5.)
Fig. 2.
Fig. 2.
ARTADE2 algorithm. A region in which positional correlations are high is selected as a candidate for predicted transcripts. Then estimations of threshold parameter and exon structure are alternately iterated while PCS increases. Finally, a transcript is obtained if the PCS value of the transcript exceeds 0.5.
Fig. 3.
Fig. 3.
Calculation procedure of match rate used in Tables 1 and 2. The size of each region used for the match rate is measured at single nucleotide resolution.
Fig. 4.
Fig. 4.
Histograms of maximum expression values for 33 239 TAIR9 representative gene models and for predicted transcripts of ARTADE2 without novel gene candidates. The ARTADE2 histogram overlaps with the right peak of the TAIR9 histogram where expression values are high.
Fig. 5.
Fig. 5.
Precisions and recalls for exons between TAIR9 gene models and transcripts predicted with several methods. The precision and recall are calculated at a single nucleotide resolution. The plot curve shifts with PCS values (ARTADE2) or P-values (ARTADE1, AUGUSTUS, TAS). 7460 TAIR9 gene models with expressions over e7 were used to compare references. Transcripts used for the comparison were limited to those that overlap mutually with references in at least 30% of the genome region from 5 end to 3 end. The precision–recall curve of ARTADE2 covers the largest area of all methods.
Fig. 6.
Fig. 6.
Electrophoresis images of novel genes. We tested to validate 16 novel gene candidates with RT–PCR for control and 2 h dry conditions. Fourteen candidates were confirmed by both RT–PCR and correct mapping of the sequence. The expression value is the median of tiling array values in exon probes.
Fig. 7.
Fig. 7.
Histograms of maximal expression values for 33 239 TAIR9 representative gene models, 22 720 NGS-ARTADE2 models and 34 426 Cufflinks models. Novel models are removed in the histograms. Similar with Figure 4, we defined threshold; maximal expression values >e6 for defining expressed genes in the case of current NGS dataset. The NGS-ARTADE2 histogram fits closely with the histogram of highly expressed models of TAIR9. On the other hand, Cufflinks has a bigger peak than TAIR9, indicating that Cufflinks tends to make multiple gene models on loci where TAIR9 has a single gene model; see Figure 8 for more detail.
Fig. 8.
Fig. 8.
Box plots of coverage for predictions using NGS-ARTADE2 and Cufflinks. Each box plot shows coverage calculated from overlap pairs between highly expressed TAIR9 gene models as reference and transcripts of those predictions. There are two kinds of coverage. ‘Coverage on prediction’ means the cover rate of predicted transcripts by correspondent reference model and ‘Coverage on reference’ is the coverage rate of reference model. Lower coverage on reference by Cufflinks indicates more fragmented predictions compared with NGS-ARTADE2.
Fig. 9.
Fig. 9.
This figure shows how factor analysis improves transcript reconstruction in comparison with reference gene models. When we compared transcript models reconstructed ARTADE2 and ARTADE2 with factor analysis (ARTADE2 + FA), we found 355 ARTADE2 models were split in ARTADE2 + FA. Among them, 25 ARTADE2 models (C32) had reference gene models with better fitting than split ones (left half of the figure). On the other hand, 285 ARTADE2 models (C33 + C34) had no good-fitting reference gene models. In most of these cases, at least one set of split gene models provided by ARTADE2 + FA had good-fitting reference gene models (right half of the figure). The remaining are cases having references in both models (C31) and are not able to be judged (C35).
Fig. 10.
Fig. 10.
Detection of an alternative isoform that was previously annotated as alternative splicing region. Here we adopted factor analysis for probes that exist in the transcript's exon region. In the figure, we plotted the factor loadings until the second factor while the factor number is set to 5. The rectangle enclosed by an orange line is a cluster created by high factor loadings. The bottom plot shows scores for 55 experiments of factor loadings of the first (horizontal) and second (vertical) factors. It seemed that NaCl stress at 10 h is only related to the upregulation of the second factor region.

Similar articles

Cited by

References

    1. Baerenfaller K., et al. Genome-scale proteomics reveals Arabidopsis thaliana gene models and proteome dynamics. Science. 2008;320:938–941. - PubMed
    1. Castellana N.E., et al. Discovery and revision of Arabidopsis genes by proteogenomics. Proc. Natl Acad. Sci. USA. 2008;105:21034–21038. - PMC - PubMed
    1. German M.A., et al. Construction of Parallel Analysis of RNA Ends (PARE) libraries for the study of cleaved miRNA targets and the RNA degradome. Nat. Protoc. 2009;4:356–362. - PubMed
    1. Grobei M.A., et al. Deterministic protein inference for shotgun proteomics data provides new insights into Arabidopsis pollen development and function. Genome Res. 2009;19:1786–1800. - PMC - PubMed
    1. Hendrickson A.E., White P.O. PROMAX : a quick method for rotation to oblique simple structure. Br. J. Stat. Psychol. 1964;17:65–70.

Publication types